ITmediaエンタープライズにて、プロセスマイニング基礎知識(2)が公開されました。ぜひご覧ください。(会員登録要)
BPIやBPR、そしてDXと、さまざまな業務改善や改革に向けたIT施策において「プロセスマイニング」は科学的かつ効果的なアプローチを探る助けとなる。実践の中でどの機能をどう使えばよいか、実践のヒントを解説する。
ITmediaエンタープライズにて、プロセスマイニング基礎知識(2)が公開されました。ぜひご覧ください。(会員登録要)
BPIやBPR、そしてDXと、さまざまな業務改善や改革に向けたIT施策において「プロセスマイニング」は科学的かつ効果的なアプローチを探る助けとなる。実践の中でどの機能をどう使えばよいか、実践のヒントを解説する。

デジタル化、グローバル化が急速に進む経済・社会において、DX、すなわち「Digital Transformation」に現在、多くの企業が取り組んでいます。DXの取り組みの中には、「紙の資料をデジタル化する」といった初歩的なものも含めるのが一般的ではあります。しかし、そうしたマイナーなデジタル化はあくまで「とっかかり」に過ぎません。
DXの本質、言い換えると究極のゴールは、自社のビジネスモデル、およびビジネスプロセスを全体的に変革することであること。ただし、デジタル経済、グローバル経済が進む現在では、デジタルを活用した変革に必然的になるということを理解しておく必要があります。
では、最終的には全社的な取り組みとなるDXの成功の鍵を握るものは何でしょうか?
もちろん、DX成功の鍵はひとつだけではありません。しかし、他のあらゆるものが揃ったとしても、これなくしては、DXを着実に推進させ成功に導くことはできないと、確信を持って言えるものがあります。それは、DXを推進する常設の専任部署である「COE(Center of Excellence)」です。特に、DXの取り組みの肝となるビジネスモデル、ビジネスプロセスを変革するためには、BPM(Business Process Management)と呼ばれる、包括的な方法論が有効であることから、BPM-COEと呼ぶ専任チームの立ち上げが重要と考えます。
これまで、部署単位でRPAによるタスク自動化を実現し、部分的な改善には成功してきたものの、会社全体での取り組みにまでは広がることがなく、「このままでは本来のDXに辿り着けない」と焦燥感を募らせた企業が、COEを設置する動きが活発になっていくと、私は考えています。
今回は、DX成功の鍵のなかでも最も重要な「BPM-COE」について解説します。
BPM COE (Center of Excellence)とは?
BPMについてはひとまず脇に置いて、COEについて説明しましょう。COEはひとことで言えば、部門横断型の業務を担当する特任組織です。基本的には常設であり、専任のメンバーが所属します。すでにCOEを立ち上げている企業も増えてきていますが、具体的には、「BPR部」や、「DX推進部」といった部署名で運営されていることが多いようです。
一方、BPM(Business Process Management)は、ビジネスプロセスを適切に運営するための方法論です。現状(as-is)のプロセスの改善だけでなく、新しいビジネスモデルに基づく、あるべき(to-be)プロセスの設計と展開、安定的運用と継続的な監視までをカバーする包括的なものです。
したがって、BPM-COEは、DXの推進の核となるビジネスモデル、ビジネスプロセスの改善や再設計、運用、継続的監視を通じた継続的改善のための方法論に基づく、DX推進の役割を果たす部署、ということになります。
なぜ、BPM-COEは部門横断型の組織なのか?
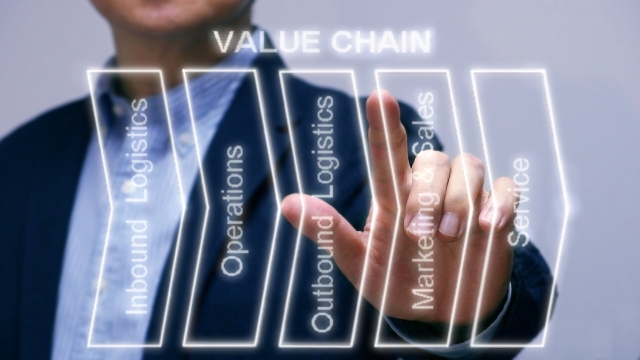
前述したように、DXの最終的なゴールは、会社全体のビジネスモデル、ビジネスプロセスの見直しです。したがって、製造業であれば、調達、生産、物流、販売、マーケティング、サービス、財務など広範囲の部署にまたがって価値を生み出す「バリューチェーン」全体を俯瞰的に捉え、全体最適化の視点でDXに取り組む必要があるからです。
なぜ、常設の特任組織なのか?
会社再建のための一時的な取り組みであれば、かって日産自動車において、各部署からのメンバーで編成されたバーチャルな組織、「ファンクショナルチーム」のような暫定組織が推進役となることも可能でしょう。しかし、DXで狙う、根本的な全社変革は長期的な取り組みであり、かつ継続的に改善し続けなければなりません。またその実行・運用に当たっては、デジタルの知識を含む高度な専門性が求められることから、データ分析やコンサルティングスキルを持つ専門職も含む常設のBPM-COEが設置されなければならないのです。
BPM-COEの役割と主要タスク
BPM-COEの基本的な役割は、全社最適化の視点で「自社のビジネスシステムやビジネスプロセスをどのように変革すべきか」を企画し、全社に展開するとともに、それによって影響を受ける各部署の業務の見直しを支援することです。すなわち、BPM-COEは、DX推進の司令塔であると同時に、各部署の変革を手助けするコンサルタントの役割を果たす必要があります。
また、どのような変革であれ、ITソリューションの導入や開発がほぼ必ず伴いますので、現場部門と、ITシステム開発を担当するIT部門との間を円滑につなぐ役割を果たさなければなりません。
BPM-COEの主要タスク
BPM-COEが主導すべきタスクには以下のようなものがあります。
・現状(as-is)のビジネスプロセスを把握し、見える化するための業務分析を行う
・見える化された現状プロセスにおける改善ポイントを洗い出し、優先順位をつけつつ改善施策を立案する
・改善施策を具体的な実行計画に落とし込み、変革が完了するまでの変更管理を行う
・変革後の効果を評価するとともに、継続的な運用管理を行い、継続的な改善を主導する
BPM-COE所属メンバーに求められるスキル
BPM-COEに所属するメンバーにはどのようなスキルが求められるでしょうか。基本的にはなんらかの専門性を有するエキスパートである必要があります。必要となる主なスキルとしては次のようなものが挙げられます。
・ビジネスモデルや、ビジネスプロセスを作成できるスキル・・・ビジネスアナリシス、ビジネスモデリング、ビジネスプロセスモデリング(ビジネスアナリスト、ビジネスコンサルタントなどと呼ばれる役職の担当)
・ビジネスモデル、ビジネスプロセスを定量的、および定性的に分析し、改善すべき課題を抽出できるスキル・・・リーン、シックスシグマ、データ分析、プロセスマイニング、タスクマイニング等含む(ビジネスアナリスト、プロセスアナリスト、データサイエンティストなどと呼ばれる役職が担当)
・あるべき(to-be)ビジネスモデル、ビジネスプロセスを着想、設計できるスキル・・・ワークデザイン、デザインシンキング、アートシンキング等、各種発想法含む(ビジネスアーキテクト、プロセスアーキテクトなどと呼ばれる役職の担当
・ビジネス要求をITの機能要件に落とし込み、またシステム開発のディレクションができる機能(ビジネスアナリスト、システムエンジニアなどと呼ばれる役職の担当)
・プロジェクトマネジメントスキル(COEは継続的な変革の取り組みを主導するものとはいえ、個々の取り組みはプロジェクトとしての立ち上げとマネジメントが必要です)

COEが機能するためには
さて、DXを主導する専任組織であるBPM-COEを立ち上げたのはいいが、うまく回らないケースがあります。うまく回らない原因についてもいろいろと挙げることができますが、逆にきちんと機能するための最低限の必要条件は、トップマネジメントの全面的なバックアップがあることです。
多数の部門が関わる全社レベルのビジネスモデルの見直し、またエンド・ツー・エンドのビジネスプロセスの根本的な組み直し、また大胆なデジタル化に取り組むことになるわけですから、現場からの反発や抵抗が不可避です。このため、トップマネジメントが、全社体制でDXを推進することの意義を語り、ビジョン、ミッションを明確に示しつつCOEを全面的にバックアップすることが求められます。
当記事は、Tartu大学教授、Marlon Dumas氏の掲載許諾を得て日本語に翻訳したものです。日本語での理解がしやすいよう、多少補足・意訳している箇所があります。日本語版の文責はすべて松尾にあります。
Marlon Dumas氏は、BPM(Business Process Management)、Process Miningの研究者として世界的に著名です。オープンソースのプロセスマイニングツール、「Apromore(アプロモーレ)」を開発販売するApromore Pty Ltdの共同創業者でもあります。
また、世界の多数の大学において、BPMの教科書に採用されている『Fundamentals of Business Process Management』の共著者です。なお、『Fundamentals of Business Process Management』の日本語版が2022年中に刊行予定です。
The Road from Process Mining to Augmented Business Process Management
プロセスマイニングから拡張ビジネスプロセスマネジメントへ
– Marlon Dumas, Professor at University of Tartu | Co-founder at Apromore
ビジネスプロセスマネジメント(BPM)の分野において、2021年はわくわくする一年となった。プロセスマイニング、タスクマイニング、デジタルプロセスツイン、予測プロセスモニタリングなどの分野で、導入の成功事例や報告が相次いだ。
そして、これからやってくるものがまだある。私たちは、BPMに対する新しいアプローチの誕生を目の当たりにしようとしているのである。データ分析と人工知能(AI)の手法を活用して、継続的なプロセス改善を実現するアプローチである。私たちはこのアプローチを拡張BPM – Augmented BPM –と呼んでいる。
2022年には、拡張BPMの方向にさらに歩みを進めることになるだろう。この記事では、拡張 BPMの出現をもたらす潮流と、これらの潮流から、組織がどのように利益を得られるかを探っている。
拡張 BPMとは?
拡張 BPMとは、データ分析とAIに基づき、プロセスの設計時と、プロセス実行時の両方でプロセス改善の意思決定を行う、ビジネスプロセス管理のアプローチである。
拡張BPMは、個々のタスクの実行や意思決定の自動化(例:機械学習コンポーネントを使用して顧客の苦情を分類する)に、分析やAIを使用する以上のものである。それは、分析とAIを全面的に利用して、ビジネスプロセスを継続的に監視し、適応させ、また再設計することである。
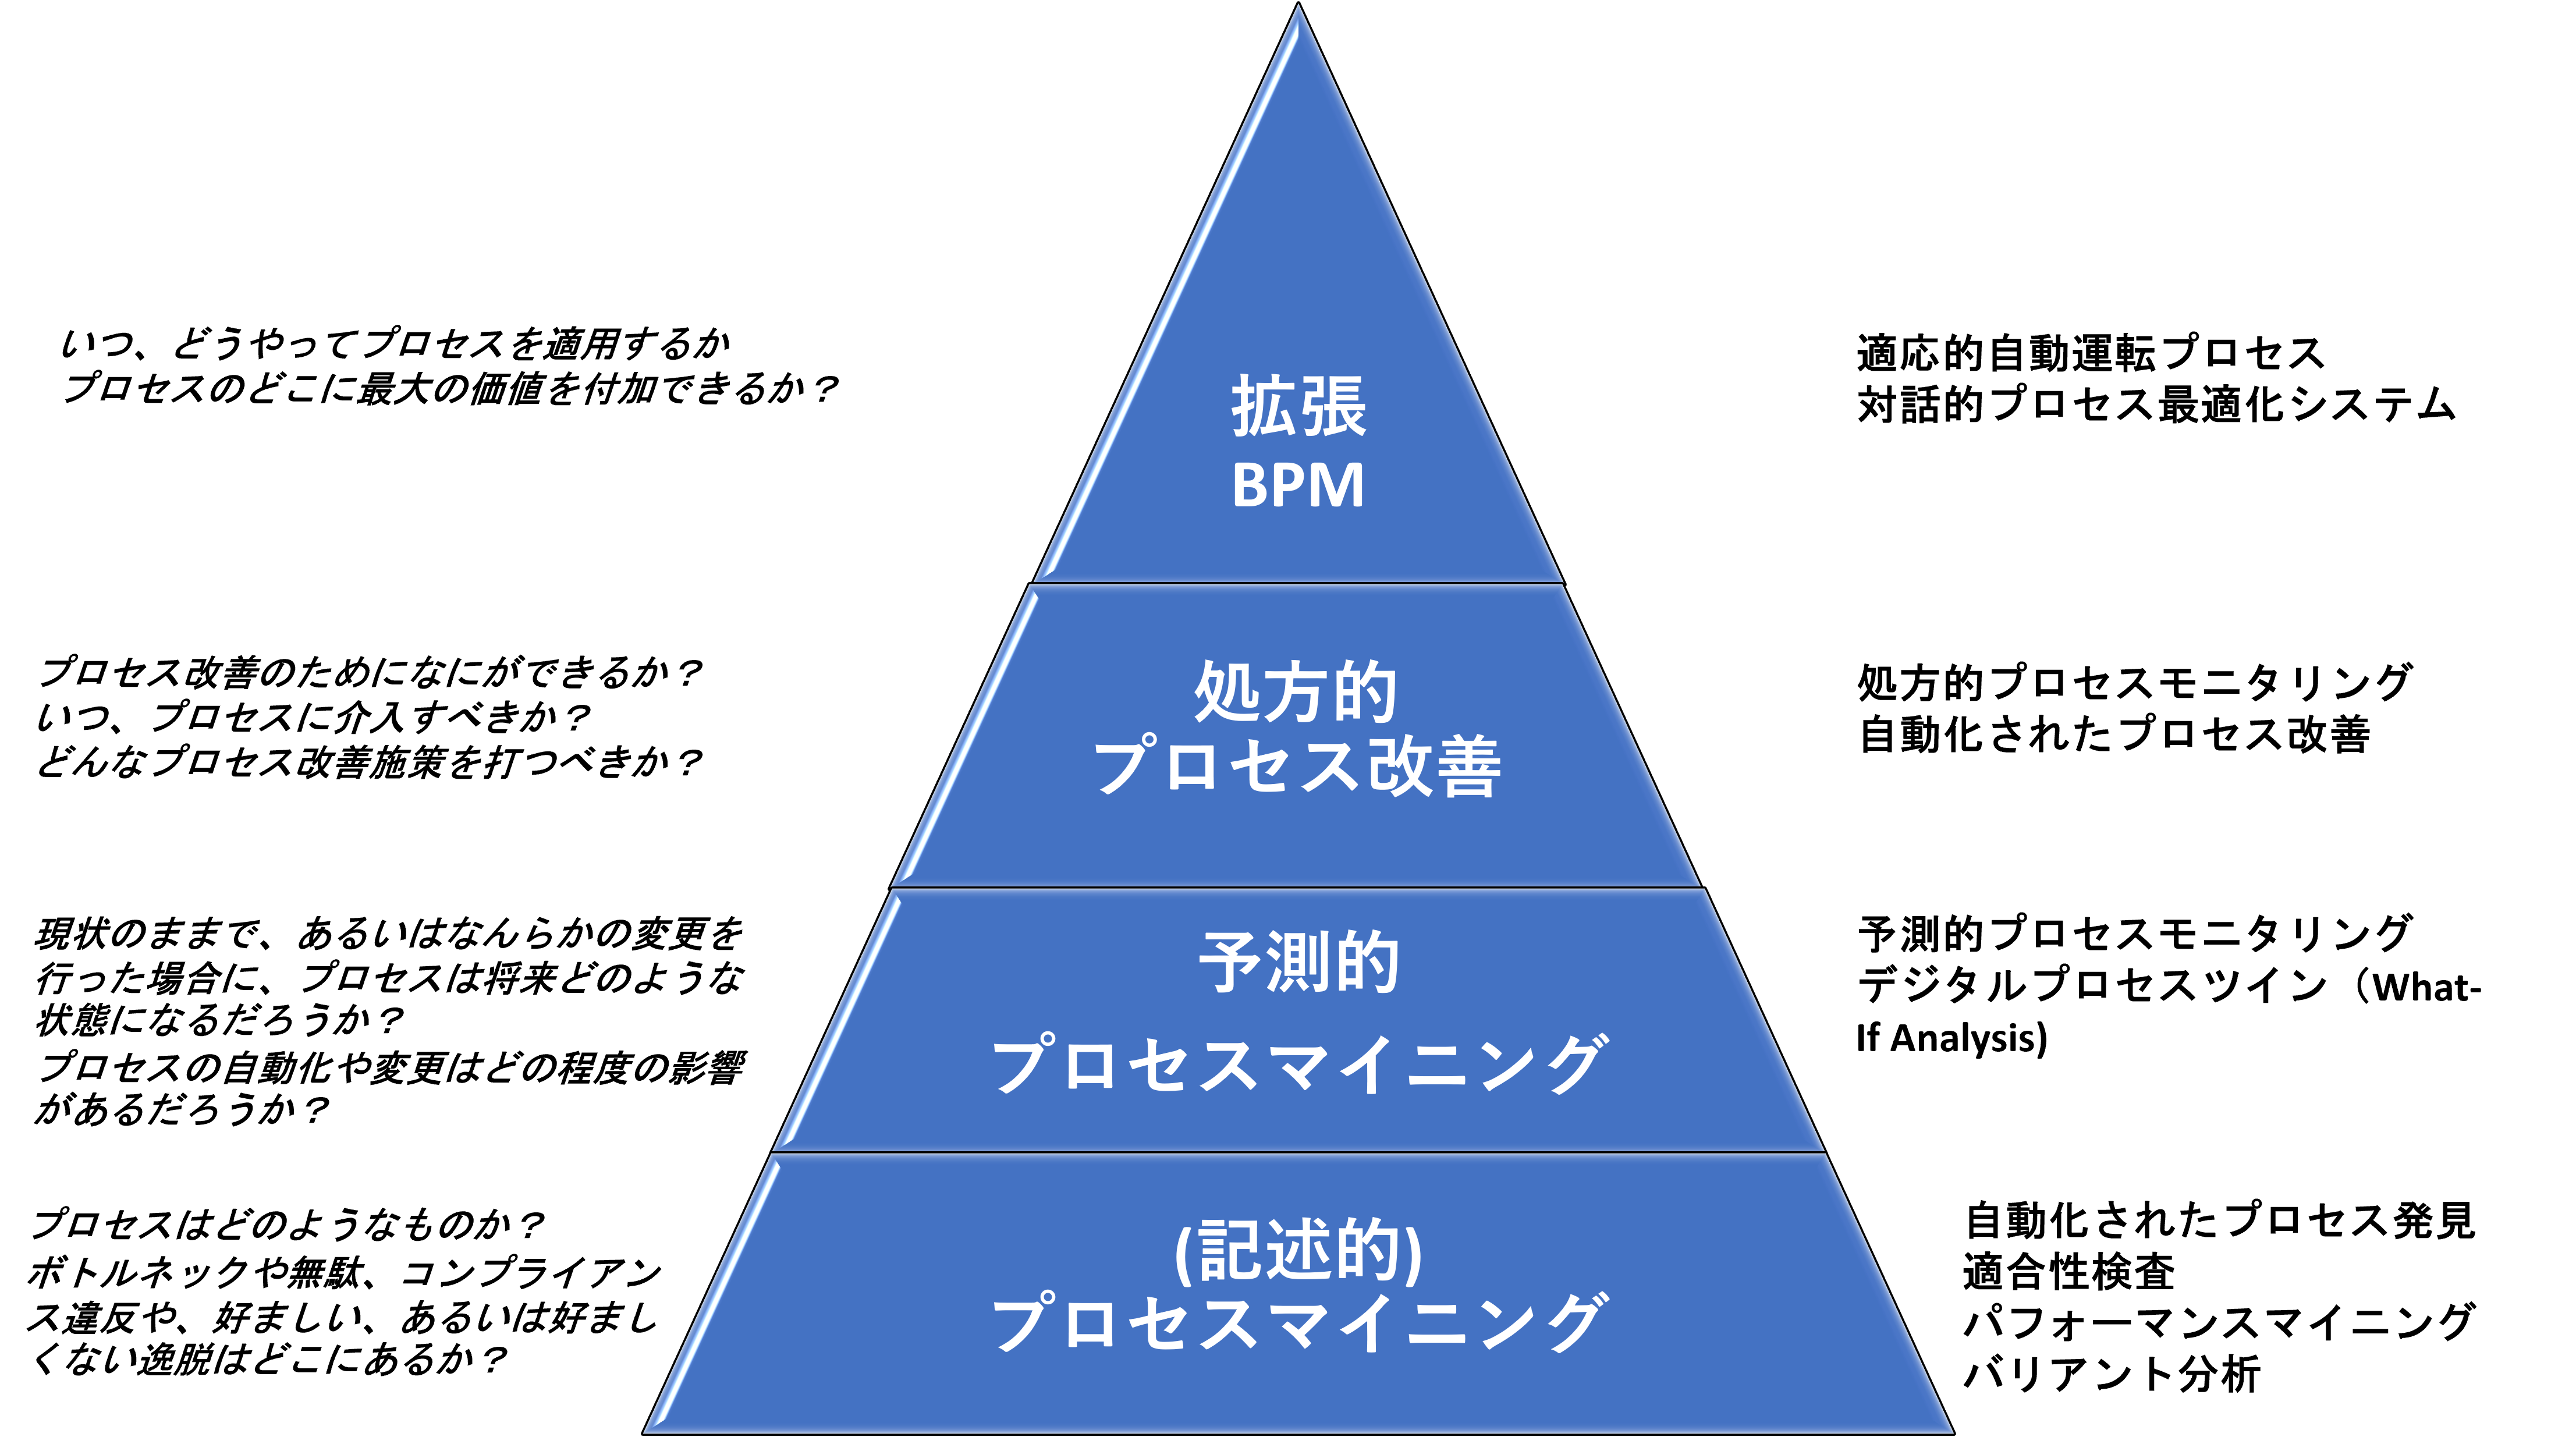
拡張 BPM ピラミッド
拡張 BPMがカバーする範囲をよりよく理解できるよう、図1に示したような「ケイパビリティ(能力)のピラミッド」として概念化した。
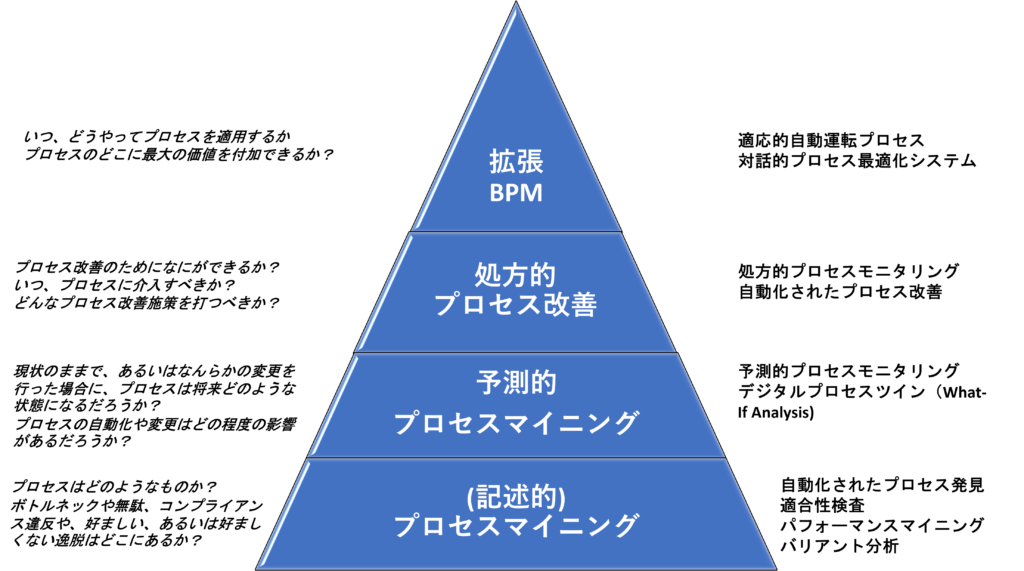
最下層には、「記述的プロセスマイニング – Descriptive Process Mining -」がある。(これは、従来のプロセスマイニングの領域である)プロセスマイニングは、企業システムから抽出したデータセットを用いてビジネスプロセスを分析する技術である。これらのデータセットはイベントログと呼ばれる。イベントログは、ビジネスプロセスの文脈においては、アクティビティ(またはアクティビティ内のステップ)の実行を捕捉した記録の集合体である。
プロセスマイニングには様々な技術が含まれるが、これらは4つのケイパビリティ領域に分けられる。
自動化されたプロセス発見 – Automated Process Discovery
データからプロセスモデルを発見し、プロセスの主な経路や例外を明らかにし、無駄(反復・手戻りや、過剰な処理など)を浮き彫りにする機能。
適合性検査 – Conformance Checking
コンプライアンスルールの違反(請求書のない購買発注など)や、観測された実際の手順と、準拠すべき規範的手順との乖離など、望ましい手順からの逸脱を検出する機能。
パフォーマンス・マイニング – Performance Mining
定量的なパフォーマンス指標をプロセスの要素に結びつける機能。例えば、SLA(Service level Agreement)に対する違反に関わるボトルネック、反復・手戻りの繰り返しがもたらす過剰なコストや無駄を明らかにする。
バリアント分析 – Variant Analysis
異なるサブセットのケース(例えば、地域別)でプロセスがどのように実行されているかを比較することにより、プロセスにおける好ましい、あるいは好ましくない逸脱を識別する機能。
これらの機能により、ボトルネック、反復・手戻り、コンプライアンス違反などの摩擦が起きている箇所を特定し、その原因やKPI(主要業績評価指標)への影響を調査することができる。これらの機能を利用して、継続的なプロセス改善に取り組んでいる企業は多い。
記述的プロセスマイニングは、それ自体が価値のある能力であるが、その長期的な価値は、それが他の豊富な能力につながる扉を開くことにある。実際、組織がプロセスマイニングのために収集した同じデータセットを使って、将来何が起こるかを教えてくれる予測モデルを構築することができる。
これにより、拡張 BPMピラミッドの第2層である「予測的プロセスマイニング – Predictive Process Mining – 」にたどり着く。記述的プロセスマイニングでは、プロセスが過去にどのように実行されてきたかを理解ができる。一方、予測的プロセスマイニングでは、プロセスが将来どのように展開するかを予測する。予測的プロセスマイニングには2つの機能がある。
予測的プロセスモニタリング – Predictive Process Monitoring
プロセスの将来の状態を予測する機能。例えば、O2C(Order-to-Cash:受注から入金まで)のプロセスでは、顧客が注文した製品が時間通りに発送されるか、あるいは遅れて発送されるかを予測することができる。一般的に、予測的プロセスモニタリングは機械学習技術を用いて実装される。まず、過去のデータをもとに予測モデルを作成し、それをイベントストリーム(現在実行中のプロセス)に適用して将来どうなるかを予測する。
デジタルプロセスツイン – Digital Process Twin
プロセスを変更した場合の影響を予測すること。例えば、ERPシステム上で実行されるO2Cプロセスを考えてみよう。記述的プロセスマイニングを適用することで、プロセスの包装工程でボトルネックが発生し、多くの遅延が発生していることが判明するかもしれない。ここで、プロセスマイニングと機械学習を用いて、デジタルプロセスツイン(DPT)と呼ばれるプロセスの複製を構築する。そして、このDPTを用いて、包装工程にスタッフを追加投入した場合に何が起こるかをシミュレーションする。DPTでは、このような変更やその他の実行可能な変更が納期遅れに与える影響度合いを推定することができる。管理者は、この機能のおかげでプロセス改善行動のROIを推定し、より効果な改善行動を見出すことができる。
プロセスがこの先どうなるかを予測することは役に立つ。しかし、予測が価値を生むのは、それに基づく改善行動があってこそだ。これが、拡張 BPMピラミッドの第3層である「処方的プロセス改善 – Prescriptive Process Improvement- 」である。処方的プロセス改善とは、予測をアクションに変えることであり、1つまたは複数のKPIに関して、ビジネスプロセスのパフォーマンスを改善するために最適なタイミングで実行される仕組みである。
この層では、「プロセスマイニング」から「プロセス改善」へと焦点が移る。プロセスマイニングでは、データからパターンを発見し、そのパターンを使ってプロセスを説明したり、予測を立てたりすることに焦点を当てる。ピラミッドの第3層では、パターンは二の次となり、代わりに、改善アクションを扱う。
処方的プロセス改善には2つの機能がある。
処方的プロセスモニタリング – Prescriptive Process Monitoring
1つまたは複数のKPIに関して、プロセスのパフォーマンスを最適化するためのアクションを、リアルタイムまたはそれに近い状態で推奨する機能。例えば、ある処方的プロセスモニタリングシステムが、バッチ製品の出荷が遅れる可能性を検出したとする。そのとき、遅延の影響を最小限に抑えるため、当該製品を注文した顧客に連絡して、製品を2つのバッチに分けて発送する選択肢を提案することを推奨できるだろう。
自動化されたプロセス改善 – Automated Process Improvement
例えば、不良率やサイクルタイムを最小限に抑えつつ、コストを削減するなど、相反するKPI間のトレードオフを実現するために、プロセスに変更を加えることを推奨する機能。自動プロセス改善システムは、週の初めに発生する特定のボトルネックを軽減するため、一部の担当者の割り当てルールや作業スケジュールを変更するようにプロセスオーナーに提案したり、誤発注を防ぐため、一部の発注書に追加の検証ステップを実行するように提案したりする。
上記のようなレコメンデーションは、行動と結果の間の因果関係を発見し、その関係を利用して、プロセスのどのような場合に(いつ)特定の行動を行うのが最適かを判断する因果推論と呼ばれる技術を用いて作成できる。
処方的プロセス改善では、人間のプロセス参加者に対し、機械が可能なアクションを提案する。人間の参加者は、これらの推奨事項を適用するか、あるいは無視するかを決定する。言い換えれば、システムと人間の参加者の間のやりとりは一方通行である。もし、改善アクションが、人間の参加者とAIとの会話の結果だったらどうだろうか?
これで4層目が見えてきた。「拡張 BPM – Augmented BPM – 」である。拡張 BPMは、ビジネスプロセス実行システムの自律性と、マシンと人間の参加者との間での豊かな対話が行われるという点で、処方的プロセス改善を超えている。拡張 BPMはまだ始まったばかりの概念であるが、すでに2つの特徴的なテーマを特定することができる。
対話的プロセスの最適化 – Conversational Process Optimization
プロセスのパフォーマンスが低下する状況を自動的に検出し、そのパフォーマンス低下の原因を人間のプロセス参加者(プロセスオーナーなど)に説明し、その対策を人間の参加者と議論する機能。例えば、対話型プロセス最適化システムが、ある種類の出荷がしばしば遅れることを検出したら、プロセスオーナーにこれらの出荷の輸送ルート変更をすべきであると提案する。人間の参加者は、ルート変更オプションのうち、いくつかは費用が増える可能性があるために採用しないかもしれない。あるいは、顧客に対して、複数の輸送ルートオプションを提供すると決定するかもしれない。当システムは、顧客の所在地に応じて、各顧客に複数の選択肢を提供することができる。
適応型自動運転プロセス – Adaptive Self-driving processes
自動化されたシステムが、プロセスの中で起こりうる次のアクションを判断し、次に取るべきアクションを決定する。また、人間への引継ぎが必要な状況を検出できる能力のこと。例えば、過去の実行データに基づいて、発注書を受け取った際に行うべき検証手順をシステムが決定することができる。これまでに見たことのない新しいタイプの購買注文をシステムが検出すると、人間の担当者に引き継ぎ、その担当者が、この新しいタイプの注文に対してどの検証を行うべきかを決定する。当システムは担当者の判断を記録しておおり、このタイプの発注書を再び受け取ったときにはそれを適用する。
ピラミッドのこの最後の層では、「プロセス改善」から「BPM」へと移行している。拡張BPMは、パターンを発見したり、プロセス再設計の提案を行うだけではない。拡張 BPMは、BPMのライフサイクル全体を扱うアプローチである。
拡張 BPMの恩恵を受けるために、自社は何ができるか?
多くの読者にとって、拡張されたBPMはあまりにも未来的であり、すぐに行動を起こすには値しないと思われるかもしれない。しかし、ピラミッドの最初の二つの層は、すでに実際に広く活用されている。また、第3の層を支える技術は急速に進化しており、すでに他の分野で成功を収めている。拡張 BPMのピラミッドを登ることで得られる利益は極めて大きい。ピラミッドを登るステップを踏まない組織は、取り残される可能性が高くなるだろう。その機会損失は無視できないほど大きい。
ピラミッドに沿った取り組みを考えている企業は、その過程で重要な3つのポイントを心に留めておくとよい。
1.基礎を固め、登り始め、登り続け、先延ばしにしない。
多くのマネージャーは、「データがない」「データが十分ではない」と言って、プロセスマイニングの導入を先延ばしにする。 確かに、プロセスマイニングのためのデータを得ることはしばしば困難である。しかし、その効果は数千もの成功事例で繰り返し実証されている。プロセスマイニングを行うためのデータを得ることで、多くの扉が開かれる。今日、プロセスマイニングに使用されたデータは、明日には予測的プロセスモニタリングや、デジタルプロセスツインの構築に使用することができる。データの収集と前処理という障害を乗り越えれば、その可能性は無限に広がる。なお、タスクマイニングは、企業システムでは、データ収集が行えない場合に、データ収集のための別の方法を提供することに留意されたい。
2.レイヤを飛ばしてはいけない。
BPMピラミッドの下層部は、上層部からビジネス価値を引き出すための基盤となる。上の層の機能を採用することで最大限の利益を得たいと考える組織は、下の層をマスターする必要がある。
3.戦略との整合を取り、段階的にガバナンスを構築する。
プロセスマイニング、予測モニタリング、また処方的プロセス改善の取り組みは、組織の戦略的優先事項に基づいて行われる必要がある。拡張BPMピラミッドの機能は、何よりもまず、組織にとって重要なビジネスプロセスに適用されるべきである。また、これらのテクノロジーは、1つのプロセスずつ段階的に採用することが重要だ。時間をかけて、ピラミッドのテクノロジーが予測可能、かつ繰り返し価値を生み出すことを保証するために、ガバナンス構造が必要である。しかし、そこに到達する前に、社内でいくつかの成功事例を作り、幹部の支持を得る。そうして、拡張BPMピラミッドのすべての能力が具体的な価値を生み出すことを示すことで、彼らの支持を維持することが重要である。
免責事項、承認およびライセンス
この作品は、タルトゥ大学の教授として書かれたものです。私の研究は、欧州研究評議会(PIXプロジェクト)とエストニア研究評議会から資金提供を受けています。また、オープンソースのプロセスマイニングソリューションを提供するApromoreの共同設立者でもあります。
この記事はクリエイティブ・コモンズ 表示一般ライセンス CC-BY 4.0 (CC-BY 4.0)の下でライセンスされています。
 Marlon Dumas – Professor at University of Tartu | Co-founder at Apromore

米ITアドバイザリ企業Gartnerが、2021年版となる『Market Guide for Process Mining』を2021年11月11日に公開しました。プロセスマイニングのマーケットガイドは2018年から毎年発行されており、今回が4回目の発行となります。
当記事では主なポイントを速報としてお伝えします。
2021年版においてバージョンアップされた、10個のプロセスマイニングができること(10 Capabilities for process mining)は以下の通りです。これらは、各種プロセスマイニングツールがおおむね提供している、あるいは今後提供を目指していると思われる機能とも言えます。
・プロセス、例外処理、案件、そして従業員の関わりについて自動的にモデル(フロー図など)を作成
・カスタマーとのやりとり、カスタマージャーニーを自動的にモデル化すること、および関連分析
・適合性検査、およびギャップ分析
・プロセスモデルの強化(改善)のための追加的分析(属性を付加した分析)
・データ前処理、データクレンジング、ビッグデータへの対応
・意思決定支援を可能にする、KPIの継続的モニタリングのためのリアルタイムダッシュボード
・予測的分析、処方的分析、シナリオ検証、シミュレーション
・プロセスマイニングアプリケーションを作成できるAPIを提供し、また高度な分析と意思決定支援が行える、様々なプロセスにまたがるプロセスマイニング分析のプラットフォーム
・ UI(User Interaction)ログに含まれる低レベルのイベントデータから有用な情報を導き出すタスクマイニング。UIログは、キーストローク、マウスクリック、データ入力などに基づいて、ユーザーが行ったタスク内の単一ステップを記録したもの
・様々な「洞察」を「行動」に移す実行機能 。これらの機能は、分析対象のアプリケーションの単純な更新から、タスクの実行をサポートするスクリプトの作成まで多岐にわたる
また、Gartnerは、プロセスマイニングが採用されるメインドライバーとして以下の5つを挙げています。
・デジタルトランスフォーメーション – Digital Transformation
・人工知能(AI) – Artificial Intelligence
・タスクオートメーション – Task Automation
・ハイパーオートメーション – Hyperautomation
・オペレーショナルレジリエンス – Operational Resilience
ハイパーオートメーションとは、ひらたく言えば、RPAなどを用いたタスクオートメーション、ワークフローやiBPMSによるプロセスオートメーション、そしてDigitalOpsによる業務オペレーション全体の自動化をチャットボット、スマーとスピーカー、AI、機械学習などの様々なテクノロジーも組み込みながら実現していこうとするものです。
オペレーショナルレジリエンスは、ビジネス環境の変化に適用するために、業務に関わる人、プロセス、情報システムを柔軟に変化させる技術です。業務のレジリエンス、すなわち弾性(回復力)が優れた企業は、競争力を維持しつつ、プロセスを局所的に、迅速に変更するために業務をスピードアップしたりスローダウンすることのできる組織能力を備えています。
標準的なプロセスマイニングのユースケースとしては以下の5つが挙げられています。なお、アルゴリズムとは、イベントログからプロセスモデルを自動的に描くために、プロセスマイニングツールに組み込まれているものです。
・アルゴリズムによるプロセス発見、分析によるプロセスの改善
・アルゴリズムによるプロセスの比較、分析、検証による監査、コンプライアンスの改善
・自動化の機会の発見と検証によるプロセス自動化の改善
・戦略と業務を結びつけ、柔軟な組織を生み出すことによる、デジタルトランスフォーメーション(DX)の支援
・アルゴリズムによるITプロセスの発見と分析に基づく、IT業務のリソース最適化の改善
2021年版で示されているプロセスマイニングの代表的ベンダー・ツールは以下の20種類です。
| ABBYY | Timeline |
| Appian (Lana Labs) | LANA Process Mining, LANA Connect |
| Apromore | Apromore Enterprise Edition |
| BusinessOptix | BusinessOptix |
| Celonis | Celonis Execution Management System |
| Datricks | Datricks |
| EverFlow | EverFlow |
| Fluxicon | Disco |
| IBM | IBM Process Mining |
| Integris | Explora Process |
| Livejourney | Livejourney |
| Minit | Minit |
| Process Analytics Factory (PAF) | PAFnow |
| Puzzle Data | ProDiscovery |
| QPR Software | QPR ProcessAnalyzer |
| SAP (Signavio) | SAP Signavio Process Intelligence |
| Software AG | ARIS Process Mining |
| Soroco | Scout Platform |
| StereoLOGIC | StereoLOGIC Process Mining, StereoLOGIC Task Mining |
| UiPath | UiPath Process Mining, UiPath Task Mining |
YouTube/Podcastとして様々なBPMの専門家との議論を公開しているProcess Pioneersに招かれ、主宰者のDanielと主に日本におけるBPMの取り組み課題について語りました。

BPM、プロセスマイニングのコンサルタントグループであるプロセスマイニング・イニシアティブ(PMI)は、ヨーロッパのBPM(ビジネスプロセスマネジメント)のスペシャリストであるGBTEC Software AGと、日本市場におけるBPMソリューションの普及と顧客サポートの強化を目的としたコンサルティング・パートナーシップ契約を締結しました。
→ 詳細はこちら
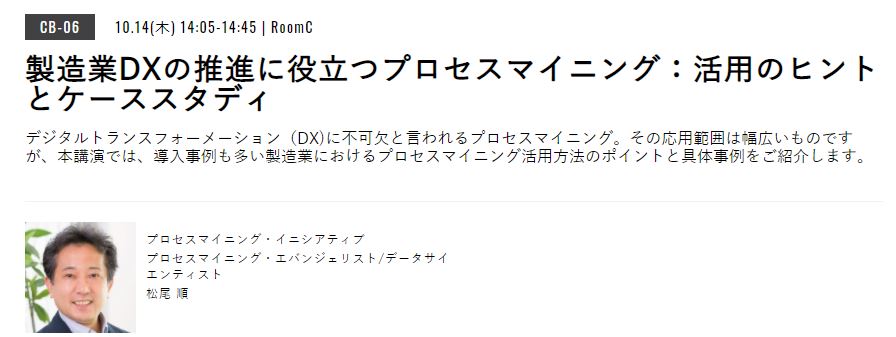
業務自動化カンファレンス2021秋の東京会場(10月14日)にて、講演の機会をいただきました。演題は、「製造業DXの推進に役立つプロセスマイニング:活用のヒントとケーススタディ」です。ライブ配信も予定されています。 ご興味ある方はぜひ登録、またご来場ください。
Latest Process Mining Functionality, Challenges, and Future Evolutionary Trends
English follows Japanese.
今回の記事では、2021年夏時点における、プロセスマイニングのテクノロジーやソリューションに焦点を当て、機能、課題、今後の進化についてお伝えします。
1 プロセスマイニングの最新機能群
プロセスマイニングは、テクノロジーやツールの側面に関心が行きがちであるが、その本質は、データ分析の理論体系・方法論(Discipline)である。実際、プロセス“マイニング”という言葉でわかるように、データマイニングの一類型と考えることができる。ただし、あらゆる事象を分析対象とする幅広い概念のデータマイニングと異なり、文字通り「プロセス」を分析対象とするのがプロセスマイニングである。その基本となる用途は「プロセスの可視化」であり、プロセスが可視化されたことによって、対象プロセスがはらむ問題点の発見が容易になる。結果として、プロセス改善の取り組みに大きな役割を果たすことができる。
1.1 現在の主要機能
さて、プロセスマイニングは、前述したように「プロセスの可視化」の方法論の確立とツール開発からその研究がスタートしている。それは、業務遂行に使用するITシステムから抽出されたデータに基づき、業務手順を示すフローチャートを自動的に作成する機能であり、「プロセス発見(Process Discovery)」と呼ばれる。その後、研究の進展、ツールの高度化に伴い、様々な機能が実装されてきた。以下は、現在のプロセスマイニングツールの多くが実装している主な分析機能である。
・プロセス発見:
業務手順を自動的にフローチャート化し、作業頻度や所要時間などを算出する
・適合性検査:
データに基づき発見された現状プロセス(as-is)と標準プロセス(to-be)との比較分析を行い、現状プロセスの逸脱を抽出する
・ダッシュボード:
対象プロセスについて、様々な切り口から集計・分析した結果を各種グラフや図でビジュアルに表示する(BIツールと同等)
1.2 最新機能群
さらに、近年では、最先端のプロセスマイニングツールでは、次のような最新機能群が搭載され始めている。
・ビジネスルールマイニング:
対象プロセスにおいて、フローの分岐(意思決定ノード)が発生している箇所がある場合、その分岐を決定している基準=ビジネスルールをデータに基づいて自動発見する
・シミュレーション(What-If分析)
プロセス発見機能によって可視化された現状プロセスについて、一部のタスクを排除したり、あるいは自動化したりすることで、どの程度の改善効果が期待できるかをシミュレートする
・運用サポート
現在仕掛中の案件について、業務遂行に関わるデータをリアルタイムに吸い上げ、業務の逸脱を探知したり、将来の問題発生を予測したりして、担当者にアラートを出す、また最善手を提案する、あるいは自動的に改善施策を実行する。
上記3つの最新機能のうち、ビジネスルールマイニング、およびシミュレーションは、既に完了した案件、すなわち過去データを分析対象としているが、運用サポートは、未完了の案件に関わるデータを逐次処理し、円滑な業務遂行を支援することが主眼である。この意味で、運用サポートは、分析の方法論の枠を超えたITソリューションの一形態とも言えるだろう。このため、プロセスマイニング業界最大手のセロニス社では、当該機能を「EMS(Execution Management System)」と呼んでいる。
2 プロセスマイニングが克服すべき課題
2.1 データ前処理の難しさ
データマイニングでは、全体の所要時間の約8割がデータの収集・抽出、クリーニングといったデータ前処理に費やされると言われる。プロセスマイニングでも同様である。多様なITシステムから抽出された数十~数百に及ぶデータファイルを適切に統合し、抜け漏れ、文字化けなどのダーティなデータを補正し、ツールに投入して分析可能な「データセット」を作り上げる労力は大きい。プロセスマイニングにおけるデータ前処理の難度を高くしている要因としては、データの抽出元が各種業務システムであることから、業務システムへの理解が必要であること、また、業務プロセス改善に資する分析結果を導くためのデータセットを作成するためには、業務自体への理解、また業務改善手法にもある程度通暁している必要があることが挙げられる。
2.2 ツールの分析品質
分析品質については2つの課題を述べたい。一つはDFGs(Directly Follows Graphs)の限界、もうひとつは、Convergence/Divergence問題である。
2.2.1 DFGsの限界
プロセスマイニングの基本機能である「プロセス発見」は、当初、ペトリネットがベースになっていたが、より現実に近いフローチャートを再現するために、様々なアルゴリズムが開発されてきている。ただ、業界有識者の話によれば、現在実用化されているプロセスマイニングツールのほとんどは、ファジーマイナーと呼ばれるアルゴリズムに基づいたもの(各社独自の改善は行っていると思われる)であると言われている。
同アルゴリズムは、一般にDFGs(Directly-follows Graphs)と呼ばれる。ペトリネットや、また業務手順をフローチャートとして記述するための世界標準であるBPMN(Business Process Modeling and Notation)と異なり、ノードとノードが直接(Directly)結びつけられたフローチャートがDFGsである。すなわち、分岐ノードが描かれないため、このアルゴリズムでは、どこでどのような分岐が発生しているのか、具体的には、排他的(OR)なのか、並行的(AND)なのか、といったことが把握できない。このため、現状のプロセスを自動的に再現するとはいっても、分岐が明確でない不完全なものになるというのが現実である。もちろん、これについては、BPMN形式のフローチャートへの自動変換や、前述したビジネスルールマイニングの採用などの機能改善が行われてきている。
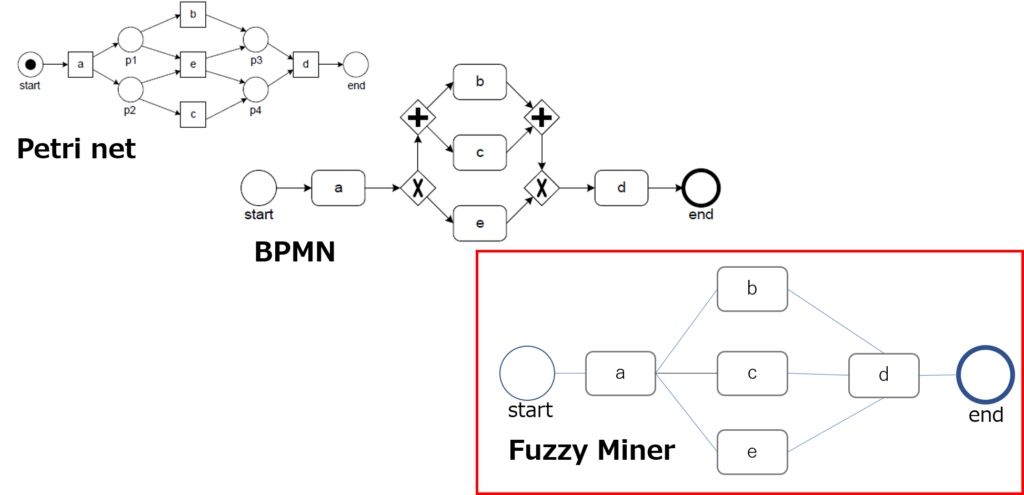
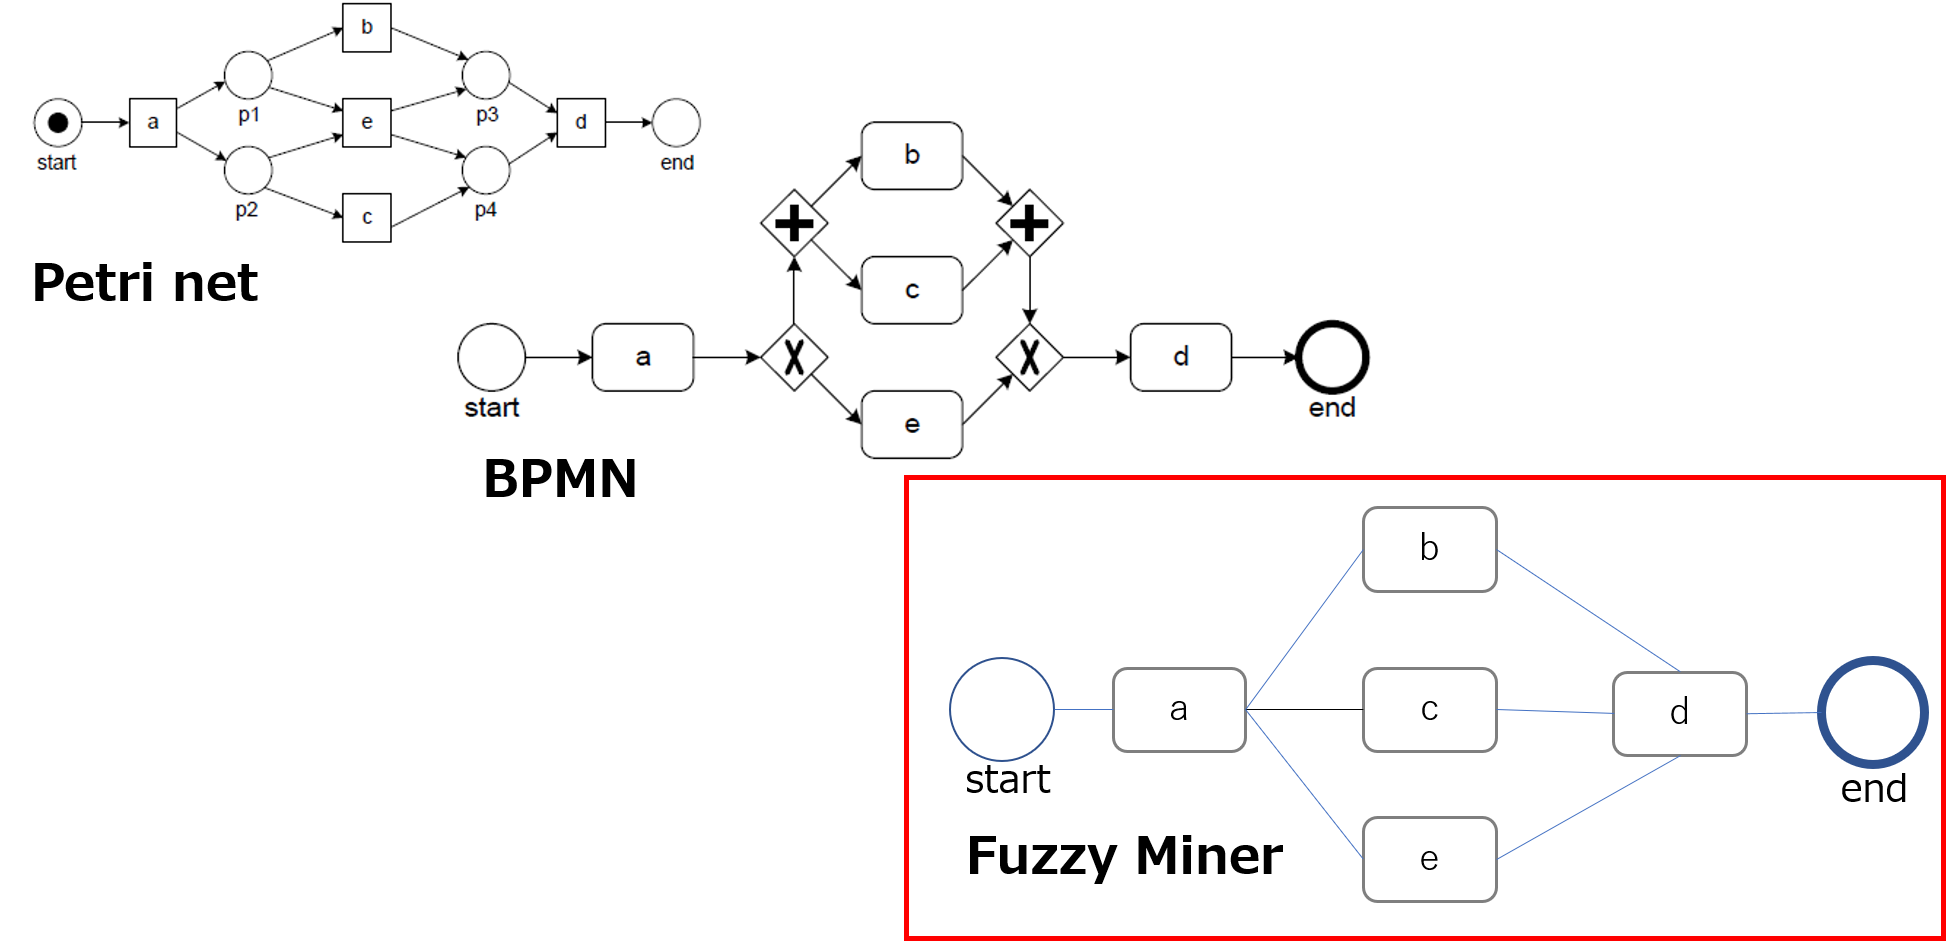
図1 Petri net、BPMN、Fuzzy Minerのフロー図例
上図でわかるように、DFGsであるFuzzy Minerには、Petri netやBPMNのような分岐ノードが存在しないため、同じプロセスの表現でありながら、Fuzzy Minerでは分岐のルールを判別することができない。
2.2.2 Convergence/Divergence問題
プロセスマイニングでは、対象プロセスで処理される案件に対して行われる各アクティビティを束ねて、フローチャートを描くために、「案件ID」、「アクティビティ(処理内容)」、およびタイムスタンプの3項目が必須である。例えば、請求書処理プロセスであれば、各請求書に付番されている個別の請求書番号、そして、その請求書に対して行われる「受領」、「確認」、「承認」、「支払い」などのアクティビティをタイムスタンプとともにITシステムから抽出することになる。
実際のプロセスにおいてしばしば直面するのは、案件IDがひとつではないという点である。具体例を示そう。図2は、エンジニアリング会社の受注から資材調達までのプロセスの一般的なイメージである。受注した機械は、発注企業の仕様に基づいて製造されなければならないため、受注後は、まず設計を行い、次に設計図(Blueprint)に基づいて必要な資材・パーツを洗い出し、サプライヤに発注する流れとなる。ここで、受注した案件は、工事番号(Construction Number)で管理されるが、一つの機械に対して複数の設計図が作成されるため、設計段階では、設計図番号(Blueprint Number)が用いられる。さらに、資材・パーツの洗い出しにはパーツ番号(Parts Number)が、調達時には、複数のパーツがいくつかにまとめられて調達要求が出される。この時は、調達要求番号(Procurement Request Number)が付番される。さらに、複数の調達要求は、サプライヤ毎に集約されて発注が行われる。ここでは発注番号(Order Number)が管理用のIDとなる。
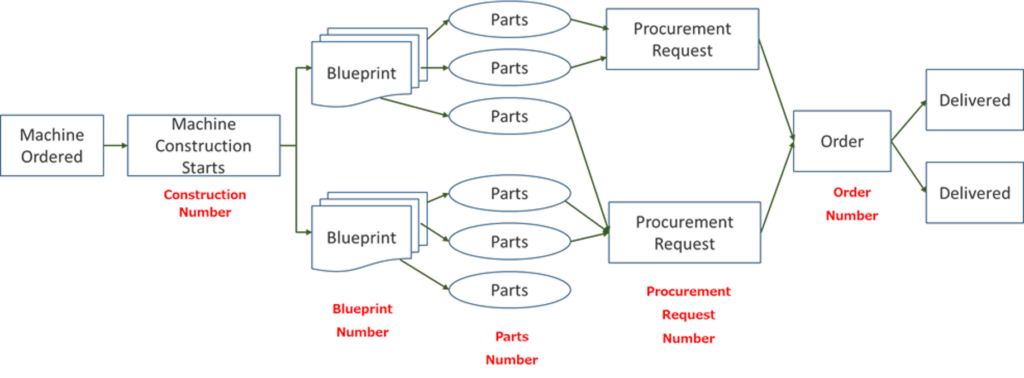
図2 受注から資材調達までのプロセス例(エンジニアリング会社)
1台の機械受注に対して複数のBluleprint、Parts、Procurement Request、Orderが紐づけられ、ひとつの案件IDだけでは適切な分析が行えない
このように、ひとつの案件が処理されていく中で、集約されたり(Convergence)、拡散したり(Divergence)するプロセスが実務ではごく普通に見られる。従来のアプローチでは、プロセス開始時の工事番号を案件IDとして資材調達までを一気通貫に分析することになるが、途中に集約や拡散が存在していると、実態とはかけ離れたプロセスが再現されてしまう。(例えば、拡散している箇所は単なる繰り返しタスクとして認識されるなど)
このConvergence/Divergence問題は、プロセスマイニングの分析品質を左右する最大の課題と言える。そこで、近年では、プロセスマイニングのゴッドファーザー、Wil van der Aalst教授が率いる研究者たちが「Object-Centric Process Mining」(1)と称する独自の方法論により当課題の解決に取り組んでいる。 また、myInvenioには、マルチレベルマイニングという機能が実装されており、一つのプロセスについて複数の案件IDを設定することで、プロセスの集約・拡散の状況を加味したフローの再現を実現している。
3 今後の進化の方向性
プロセスマイニングは、データ分析の枠を超えて、業務支援ソリューションとしての役割も果たしつつあることは前述した。ここでは、プロセスマイニングは今後、どのように進化していくのか、俯瞰的な視点で述べてみたい。
3.1 プロセスマイニング1.0
プロセスマイニングは。現状のプロセスをデータから自動再現する「プロセス発見」が基本機能であった。これは、現状をありのままに描きだすという点において「記述的分析(Descriptive Analysis)」である。
ただし、本来やりたいことは、プロセスに潜む非効率性やボトルネックなどの問題個所の抽出である。つまり、どこが悪いのか、を探し出さなければならない。そこで、この部分の処理時間が長すぎる、あるいは繰り返しが多いなど、容易に問題と思われる個所を教えてくれる機能が付加されている。診断的分析(Diagnostic Analysis)に属する機能である。プロセスマイニングツールでは、一般に「根本原因分析(Root Cause Analysis)」と命名されている。
以上は、過去データを対象とする分析機能であり、プロセスマイニング1.0と呼ぶべきものであろう。
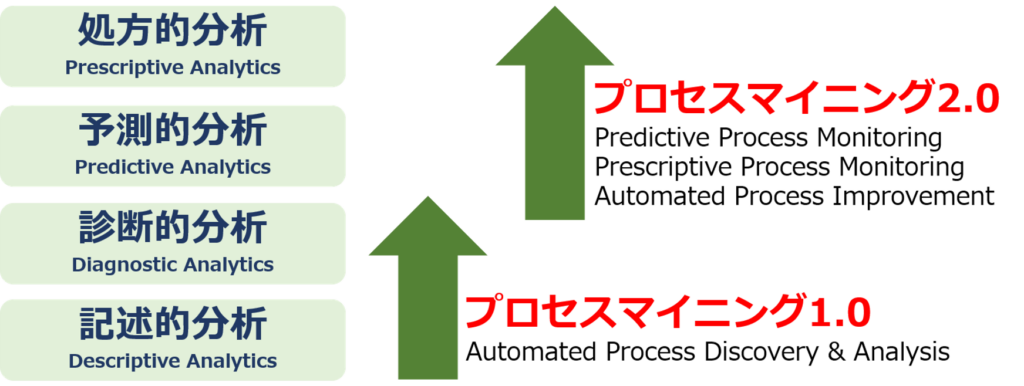
図3 プロセスマイニングの進化
プロセスマイニングの機能は、プロセスマイニング1.0から2.0へと大きく進化しつつある
3.2 プロセスマイニング2.0
プロセスマイニングの分析対象として、未完了、すなわち現在進行中の案件データをリアルタイムに取り込むようになると、逸脱の発見に加えて、現在走っている案件はあとどのくらいで完了しそうなのか、といった所要時間の予測や、将来に発生するかもしれない逸脱の予測も可能になる。こうした予測的分析(Predictive Analysis)が実装されたツールも増えつつある。
さらには、予測結果に基づいて、所要時間を短縮するために、あるいは将来の逸脱発生を未然に防ぐために、今どのような対応を行うべきかを提案する機能を持つツールも登場しつつある。これは「処方的分析(Prescriptive Analysis)」の機能である。
こうした未完了データを扱うプロセスマイニング分析は、既存のプロセスマイニング1.0を大きくバージョンアップするものであり、プロセスマイニング2.0と呼ぶことができるであろう。
予測的分析、処方的分析は未成熟であり、その信頼性は必ずしも高いとは言えないが、今後のさらなる技術進展を通じて、ERPなどのエンタープライズシステムに基づく円滑な業務遂行を支援する価値あるソリューションとして多くの企業への導入が進むことは間違いないと思われる。
Latest Process Mining Functionality, Challenges, and Future Evolutionary Trends
Process mining tends to attract attention in terms of technology and tools, but its essence is a theoretical system and methodology (discipline) of data analysis. In fact, as the term “process” mining suggests, it can be considered as a type of data mining. However, unlike data mining, which is a broad concept that targets all kinds of events for analysis, process mining literally targets “processes” for analysis. The basic use of process mining is “process visualization,” and the visualization of processes facilitates the discovery of problems associated with the target processes. As a result, it can play a significant role in process improvement efforts.
As mentioned above, the research of process mining has started from the establishment of the methodology of “process visualization” and the development of tools. It is a function to automatically create a flowchart showing business procedures based on data extracted from IT systems used for business execution, and is called “Process Discovery. Since then, various functions have been implemented as research has progressed and tools have become more sophisticated. The following are the main analysis functions implemented in most of the current process mining tools.
Process Discovery
automatically create a flowchart of business procedures and calculate the frequency of work and time required.
Conformance Checking
compares and analyzes the current process (as-is) discovered based on data with the standard process (to-be), and extracts deviations from the current process.
Dashboards
A function to display the results of aggregation and analysis of target processes from various perspectives in various graphs and tables.
In addition, in recent years, the most advanced process mining tools have begun to include the following latest functions.
Business Rule Mining
When there is a flow branching (decision node) in a target process, it automatically discovers the criteria (business rules) that determine the routing based on the data.
Simulation (What-If Analysis)
Simulate how much improvement can be expected by eliminating or automating some of the tasks in the current process visualized by the process discovery function.
Operational Support
For projects that are currently in progress, the system absorbs data related to business execution in real time, detects deviations in business operations, predicts future problems, and alerts the person in charge, suggests the best course of action, or automatically implements improvement measures.
Of the three latest functions mentioned above, business rule mining and simulation analyze past data, i.e., data that has already been completed, while operational support focuses on supporting smooth business execution by sequentially processing data related to unfinished projects. In this sense, it can be said that operational support is a form of IT solution that goes beyond the framework of analysis methodology. For this reason, Ceronis, the largest company in the process mining industry, calls this function “EMS (Execution Management System).
As seen in the acquisition of Signavio, a major tool vendor, by SAP and myInvenio by IBM, process mining is increasingly recognized as an important tool that is part of IT solutions. However, there are issues that need to be overcome in order for it to be used properly in business practices and to bring results. In this section, I would like to present the main issues from two perspectives.
In data mining, it is said that about 80% of the total time required is spent on data preprocessing such as data collection, extraction, and cleaning. The same is true for process mining. It takes a lot of effort to properly integrate dozens to hundreds of data files extracted from various IT systems, to correct dirty data such as omissions and garbled characters, and to create a “data set” that can be fed into tools for analysis. Factors that make data pre-processing in process mining difficult include the fact that the source of data extraction is various business systems, and thus an understanding of the business systems is necessary. In addition, in order to create a data set to derive analysis results that contribute to business process improvement, it is necessary to understand the business itself and to have some familiarity with business improvement methods.
There are two issues that need to be addressed regarding the quality of analysis. One is the limitation of DFGs (Directly Follows Graphs), and the other is the Convergence/Divergence problem.
The basic function of process mining, “process discovery,” was initially based on Petri nets, but various algorithms have been developed to reproduce flowcharts closer to reality. However, according to industry experts, most of the process mining tools currently in practical use are said to be based on an algorithm called fuzzy miner (each company is believed to have made its own improvements).
This algorithm is commonly called DFGs (Directly-follows Graphs). Unlike Petri nets and BPMN (Business Process Modeling and Notation), which is the world standard for describing business procedures as flowcharts, DFGs are flowcharts in which nodes are directly connected to each other (directly). In other words, since branching nodes are not drawn, the algorithm cannot grasp where and how the branching is occurring, specifically, whether it is exclusive (OR) or concurrent (AND). For this reason, even if the current process is automatically reproduced, the reality is that the branching is not clear and incomplete. Of course, functional improvements have been made in this regard, such as automatic conversion to BPMN format flowcharts and the adoption of business rule mining as mentioned above.

In process mining, three items, “case ID,” “activity (event),” and timestamp, are essential to draw a flowchart by bundling each activity performed for a case processed in the target process. For example, in the case of an invoice processing process, the individual invoice number attached to each invoice and the activities such as “receipt,” “confirmation,” “approval,” and “payment” for that invoice are extracted from the IT system along with the time stamp.
What we often face in the actual process is that there is no single case ID. Let’s take a concrete example. The figure below shows a general image of the process of an engineering company from order receipt to material procurement.

Since the ordered machine must be manufactured based on the specifications of the ordering company, after receiving the order, the company first designs the machine, then identifies the necessary materials and parts based on the blueprint, and then places an order with the supplier. Since multiple blueprints are created for a single machine, the Blueprint Number is used in the design stage. In addition, the Parts Number is used to identify materials and parts, and at the time of procurement, multiple parts are combined into several parts and a procurement request is issued. In this case, a Procurement Request Number is assigned. In addition, the multiple procurement requests are aggregated to each supplier and an order is placed. In this case, the Order Number becomes the ID for management.
In this way, the processes of convergence and divergence are commonly seen in practice as a single case is processed. In the conventional approach, the construction number at the beginning of the process is used as the case ID, and the entire process is analyzed up to the procurement of materials, but if there is convergence or divergence in the process, a process that is far from the actual situation is reproduced. (For example, the diffused part is recognized as a mere repetitive task.)
This Convergence/Divergence problem is the biggest issue that affects the analysis quality of process mining. In recent years, researchers led by Professor Wil van der Aalst, the Godfather of Process Mining, have been working on solving this problem using a unique methodology called “Object-Centric Process Mining” .
We have already mentioned that process mining is playing a role as a business support solution beyond the framework of data analysis. In this section, we will discuss how process mining will evolve in the future from a bird’s eye view.
Process mining is. The basic function of process mining was “process discovery,” which automatically reproduces the current process from data. This is a “Descriptive Analysis” in that it depicts the current state as it is.
However, what we originally wanted to do was to extract problem areas such as inefficiencies and bottlenecks hidden in the process. In other words, we need to find out what is wrong with the process. Therefore, there is an additional function that can easily tell us where the problem is, such as the processing time of this part is too long or there are too many repetitions. This is a function that belongs to Diagnostic Analysis. In process mining tools, it is generally named “Root Cause Analysis.
The above is an analysis function for historical data, and should be called Process Mining 1.0.

When process mining starts to take in uncompleted, i.e., ongoing, case data in real time as a target of analysis, it becomes possible not only to detect deviations but also to predict how long it will take to complete the currently running case, and to predict deviations that may occur in the future. In addition, it is possible to predict how long it will take to complete a case that is currently running, and to predict future deviations. The number of tools that implement such predictive analysis is increasing.
Furthermore, based on the prediction results, tools that can suggest what actions should be taken now to shorten the time required or to prevent future deviations from occurring are also emerging. This is the function of “Prescriptive Analysis”.
Such process mining analysis that deals with incomplete data is a major upgrade of the existing process mining 1.0, and can be called process mining 2.0.
Although predictive and prescriptive analyses are still in their infancy and their reliability is not necessarily high, it is certain that they will be introduced to many companies as valuable solutions to support smooth business execution based on enterprise systems such as ERP through further technological progress in the future.
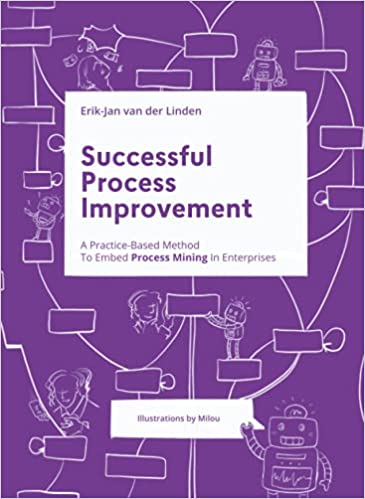
2021年6月刊行のプロセスマイニング本(英語版)のご紹介です。
以下の目次をご覧いただくとおわかりのように、プロセスマイニングの取り組みをステップ・バイ・ステップで解説した内容となっています。これまでのものよりも、さらに実務寄りとなっており、それだけビジネスへの活用が進んでいることの証かと思います。
Successful Process Improvement: A Practice-based Method to Embed Process Mining In Enterprise
Ⅰ Introduction
Ⅱ Essentials
1. Process, Improvement, Mining
2. Process Mining Technique
Ⅲ Strategy
3. Deciding to Start Process Mining
4. Starting Process Mining with Proof of Value
Ⅳ Tactics
5. Setting Up Roles, Team Organization, Stages
6. Assessing Business Problems
Ⅴ Operation
7. Preparing Data
8. Process and Business Logic
9. Discovery and Analysis in General
10.Discovering the Process: Controlling the Variation Space
11.Analyzing Conformance
12.Analyzing Peformance
13.Assessing Resources
14.Communicationg about Resuls
15.Process Control: Monitoring and Intervention
16.Selecting a Process Mining Tool
17.Future
18.Final Notes and Thanks
Ⅵ Additional Material
19.Appendix 1: Use Cases
20.Appendix 2: Tooing


Process Mining Products PEAK Matrix(R) Asessment 2021
ダラスに本社を置くコンサルティング&調査会社のEverest Groupは、2021年6月4日、主要なプロセスマイニングベンダー18社について、以下の2つの軸での市場ポジショニング(山脈に見立てているので「PEAK Matrix」)を発表しました。
プロセスマイニングについてのEverest Peak Matrixは、2020年版につづいて2年目です。
横軸:Vision & Ability – Measures ability to deliver products successfully
製品開発ビジョンを示し、それに沿った製品を成功裡に提供できる能力
縦軸:Market Impact – Measures impact created in the market
市場に与えるインパクトの強さ
PEAK Matrixでは、競合製品をLeaders(リーダー)、Major Contenders(主要な競争相手)、Aspirant(上を狙う野望を持つ製品)の3つにカテゴライズします。Process Mining市場では、それぞれのカテゴリーに含まれる製品は次の通りです。
Leaders
Major Contenders(アルファベット順)
Aspirants
2020年版からの主な変化としては、リーダーグループでは、MinitがMajor Contendersから昇格したことが挙げられます。結果、Leadersに位置付けられたベンダーは4社となりました。
Major Contenders、すなわちリーダーグループに闘いを挑んでいる主要な競争ベンダーについては、前回は8社でしたが、今回は11社と増え、さらに競争が激化しています。まだあまり知名度の高くないMonky Miningや、Upfluxが登場。
また、このところ急速に機能を拡張してきたApromoreが前回よりも高い位置まで登っています。
Aspirantsとしても、新興ベンダーと思われますが、Livejourney、Integris、Live Objectsの3社が登場しました。
なお、日本で本格展開しているプロセスマイニングツールは、Celonis、Uipath、myInvenio、Signavio、ABBYY Timelineの5社です。(ABBYY Timelineが、今回のPeak Matrixから除外された理由は今のところ不明)
レポート詳細は以下から入手可能です。(有料)
Process Mining – Technology Vendor Landscape with Products PEAK Matrix(R) Assessment 2021

Reference Matrix for Process Mining Tool Selection
English follows Japanese. Before proofread.
プロセスマイニングは近年、DX推進・定着に役立つソリューションとしての認知・理解がさらに進みました。また、先のIBMによるmyInvenioの買収や、SAPによるSignavioの買収が示すように、プロセスマイニングが、大手IT企業のソリューションに組み込まれることで、企業のITシステム開発・運営に欠かせない構成要素として重要性が高まっていくことは間違いありません。
さて、企業が、プロセスマイニングを活用したビジネスプロセス改善やシステム改修・開発に取り組むに当たって、言うまでもなく、プロセスマイニングツールの採用が必須であり、自社にとって最適なツールの選定は成功の大きなカギを握っています。
今回は、自社では、プロセスマイニングツールのどのような機能が特に必要となるのかを判断する助けとなるマトリックスを解説いたします。
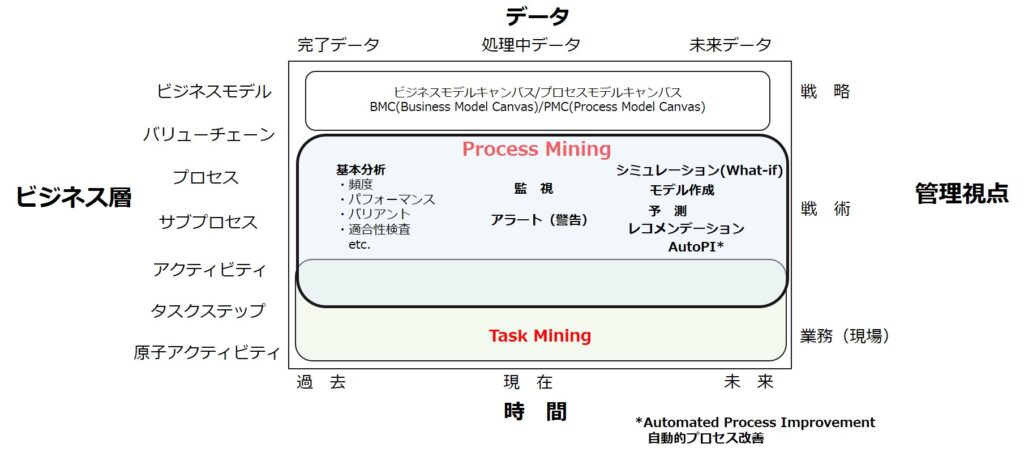
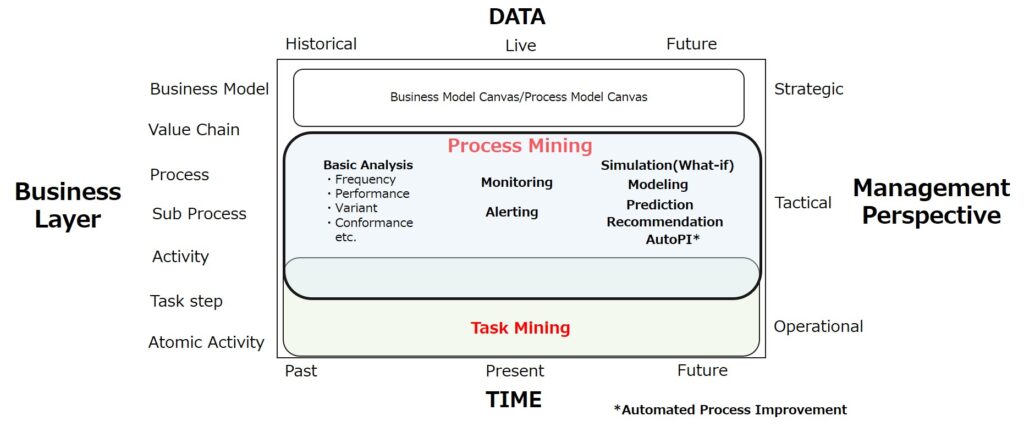
マトリックスの横軸:時間
分岐対象は、時間と言う視点では、過去の完了したプロセスなのか、それとも現時点で処理中のプロセスなのか、それともこれから遂行されるであろう未来のプロセスなのか、ということです。
一般に、データ分析は完了した過去データを対象に行います。プロセスマイニング分析においても同様で、完了したイベントログデータをプロセスマイニングツールで分析することで、現状プロセスを自動的にモデル化し、様々な視点での分析(基本分析)を行います。
例えば以下のような基本分析があります。
・頻度分析
・パフォーマンス分析(所要時間やコストの視点での分析)
・バリアント分析
・適合性検査(現状プロセスと理想プロセスの比較分析)
など。
プロセスマイニングツールの進化系では、現在進行中のイベントログデータをリアルタイムに近い頻度でプロセスマイニングツールに取り込んで、リアルタイム監視を行い、逸脱などの問題を探知すれば、関係者にアラートを出すという機能を備えています。
これから行われるであろう未来のプロセスについては、以下のような機能が対応します。
・シミュレーション(What-IF)
現状のプロセスをなんらか改善した場合に、どれだけの改善効果(スループット短縮やコスト削減など)が得られるのか、シミュレーションを実行する。
・モデリング
実装すべき理想プロセスの流れをBPMN形式でモデル化する。
・予 測
仕掛中案件が、今後どのような手順で処理されていくことになるのか、所要時間がどの程度になるのか、といった予測をAIなどを活用して行う。
・レコメンデーション
上記予測結果を踏まえて、問題発生や処理時間の長期化を未然に防ぐための最善の打ち手を提案する。
・自動的なプロセス改善(AutoPI:Automated Process Improvement)
プロセス改善のための打ち手を一定の条件において、プロセスマイニングツールが自動的に実行し、迅速な対応を実現する。
マトリックスの縦軸:ビジネス層
ビジネス層とは、プロセスの視点でより詳細な構成要素に因数分解していくものです。管理的には、上位にあるほど「戦略的」であり、下層にむかって「戦術的」、そして「業務的(日々の現場管理)」な視点が必要となります。
最上部は、ビジネスモデルです。そこから、企業全体のプロセスをEnd-to-Endで把握するバリューチェーン、バリューチェーンを構成する個々のプロセスと粒度が細かくなっていきます。
どのようなビジネスプロセスであれ、それはいくつかのサブプロセスに分解できます。さらにひとつのサブプロセスは、より細かいタスクで構成され、そのタスクは複数のアクティビティで構成されています。
たとえば、経理部門での「請求書処理」というサブプロセスを考えると、これは「請求書を受領する」、「請求書の内容を確認する」、「請求書を経理システムに登録する」、登録した請求書に対する支払処理を行う」といったアクティビティが含まれます。
これらのアクティビティのうち、「請求書を受領する」の場合、「PDF請求書添付のメールを開封する」、「添付されたPDF請求書をダウンロードする」といった一つひとつのタスクステップが実行されていくことになります。
さらにこうしたタスクステップは、PCの操作単位では、メールソフトアイコンをクリック、メール開封をクリック、添付ファイルをクリックといった最小単位のアクティビティが実行されており、これらはこれ以上分解できないアクティビティであることから「原子アクティビティ」と呼ばれます。
プロセスマイニングが分析対象とするのは、基本的には、プロセス層からアクティビティ層(場合によってはタスクステップ層)です。ITシステム内に記録されているトランザクションデータは多くの場合、比較的粒度の粗いアクティビティレベルであるという分析対象データそのものの制約があります。
そこで、より粒度の細かいタスクステップ、原子アクティビティまでの分析を行うために活用されるのがタスクマイニングです。タスクマイニングはまだ誕生したばかりの分析手法であり、BI的な集計以上の深い分析方法についてはまだ試行錯誤の段階ではありますが、プロセスマイニングと併せて活用することで、特にRPAによるプロセス自動化に貢献します。
さて、貴社のビジネスプロセス課題と照らして、分析対象とすべきなのは、過去、現在、未来のどれでしょうか?また、ビジネス層としては、どの粒度のプロセスでしょうか?
ツールベンダーのご担当の方とは、一緒にこのマトリックスを見ながら、自社はどこに問題意識を持っているのかを認識しつつ、これらの機能をどの程度実装できているかを把握していきましょう。
なお、マトリックスには記載しておりますが、プロセスマイニングの対象とはならない、ビジネスモデル層については、ビジネスモデルキャンバス(BMG:Business Model Canvas)、プロセスモデルキャンバス(PMG:Process Model Canvas)といったツールが活用できます。
Reference Matrix for Process Mining Tool Selection
In recent years, process mining has been further recognized and understood as a useful solution for promoting and establishing DX. In addition, as shown by the recent acquisition of myInvenio by IBM and Signavio by SAP, there is no doubt that process mining will become increasingly important as an indispensable component of corporate IT system development and operation as it is incorporated into the solutions of major IT companies.
Needless to say, the adoption of process mining tools is essential for companies to improve their business processes and to renovate and develop their systems using process mining, and the selection of the best suited tool for your company is a major key to success.
In this article, I will explain a matrix that will help you determine what functions of process mining tools are particularly necessary for your company.
●Horizontal axis of the matrix: Time
From the perspective of time, there are three dimensions which are completed processes in the past, processes in progress at the moment, and future processes to be executed in the future.
In general, data analysis is done on completed historical data. The same is true for process mining analysis. By analyzing completed event log data with process mining tools, we can automatically model current processes and analyze them from various perspectives (basic analysis).
For example, the following basic analysis is available.
etc.
There are some process mining tools which can do continuous monitoring and if problems such as deviations are detected, alerts are sent to the relevant parties by importing ongoing event log data to the process mining tool at a frequency close to real time.
For future processes that will take place in the future, the following functions will be supported.
Simulation (What-IF Analysis)
Simulate how much improvement (throughput reduction and cost reduction, etc.) can be obtained if the current process is improved in some way.
Modeling
Model the flow of the ideal process to be implemented in BPMN format.
Forecasting
predict how in-process projects will be processed in the future and how much time will be required by using AI.
Recommendations
Based on the results of the above predictions, the tool proposes the best measures to prevent problems from occurring and prolonging the processing time.
Automated Process Improvement (AutoPI)
A process mining tool automatically executes measures for process improvement under certain conditions to achieve a quick remedy.
●Vertical axis of the matrix: Business layer
The business layer is a factorization into more detailed components from a process perspective. Administratively, the higher the layer, the more “strategic” it is, and the lower the layer, the more “tactical” it is, and the more “operational” (day-to-day on-site management) it needs to be.
At the top is the business model. From there, the granularity becomes finer, including the value chain that grasps the processes of the entire company from end-to-end, and the individual processes that make up the value chain.
Any business process can be broken down into a number of sub-processes. One more sub-process is composed of finer-grained tasks, and those tasks are composed of multiple activities.
For example, if we consider a sub-process called “invoice processing” in the accounting department, this includes activities such as “receiving invoices,” “checking the contents of invoices,” “registering invoices in the accounting system,” and “processing payments for registered invoices.
Among these activities, in the case of “receive invoice,” each task step is executed one by one, such as “open the email with the PDF invoice attached” and “download the attached PDF invoice.
In addition, these task steps are executed in the smallest units of PC operations, such as clicking on the mail software icon, clicking on open mail, and clicking on the attachment. These are called “atomic activities” because they cannot be decomposed any further.
Process mining basically analyzes the activity layer (or task step layer, as the case may be) from the process layer. transactional data recorded in IT systems are often at the activity level, which is relatively coarse-grained. In many cases, transaction data recorded in IT systems is at a relatively coarse activity level.
Therefore, task mining is used to analyze task steps and atomic activities with finer granularity. Task mining is still in its infancy, and it is still at the stage of trial and error for deeper analysis besides BI-like aggregation. However, by using it together with process mining, it can contribute to process automation, especially with RPA.
Now, in light of your company’s business process issues, which should be the target of analysis: past, present, or future? Also, at what granularity should the process be analyzed as a business layer?
With the person in charge of the tool vendor, let’s look at this matrix together to understand the extent to which these functions can be implemented while recognizing where the company is aware of the issues.
For the business model layer, which is not subject to process mining, tools such as Business Model Canvas (BMG) and Process Model Canvas (PMG) can be used.
Process Mining in Practice – Business Process Improvement with fact-based process discovery and BPM perspective
日本人による初めてのプロセスマイニング書籍、『DXに必須 プロセスマイニング活用入門:ファクトベースの業務改善を実現する』を2021年5月に発行します。
本書では、ビジネス分析のためのソリューションである「プロセスマイニング」の基本を踏まえつつ、データ分析に基づく業務プロセス改善の具体的な取り組みについて、BPM(Business Process Management)の視点で詳しく解説しています。
デジタルトランスフォーメーション(DX)に取り組んでいる方、業務プロセスの根本的改革のためのBPRに取り組んでいる方、また継続的な日々のプロセス改善に取り組んでいる方にとって必携の書です。
ぜひ、お読みください。
SPARK Matrix(TM): Digital Twin of an Organization (DTO) Solution, 2021
米国の経営コンサルティング会社、Quadrant Knowledge Solution社の市場調査レポート、「SPARK Matrix(TM): Digital Twin of an Organization (DTO) Solution, 2021」が2021年3月3日に公開されました。
Digital Twin of an Organization (DTO) とは?
Digital Twin of an Organization (DTO)は、一般に、「DTO」、または短く「デジタルツイン」と称されます。DTOは、現実のアナログな企業の形態にそっくりな、デジタルの双子の片割れ、言い換えると「レプリカ(複製)」のことです。
DTOは、より具体的には企業の業務プロセスや、組織体制、システム構成などをデジタルデータに基づいてモデル化し、ディスプレイ上で可視化したものです。企業は、DTOを通じて現状を把握し、問題点を発見し、シミュレーションを行うなどして、最適な改善施策を練り、実行に移すことが可能になります。またDTOによるモニタリング(監視)によって、継続的な改善を行うことができます。
SPARK Matrix(TM):Digital Twin of an Organization (DTO) Solution
今回発表されたSPARK Matrixでは、DTOを実現する各種商用ソリューションを比較分析しています。検討対象となったソリューションは合計16種です。SPARK Matrixでは、これらを以下の3つのカテゴリーに分類しています。
・Technology Leader
・Challengers
・Aspirants
そして、Technology Leaderに含まれるソリューション(ベンダー)は、以下の8種となっています。
・Software AG
・Signavio
・Celonis
・myInvenio
・CANEA
・Cosmo Tech
・QualiWare
・QPR Software
なお、上記ベンダーのうち、Software AG、Signavio、Celonis、myInvenio、QPR Softwareは、プロセスマイニングソリューションの代表的なベンダーでもあります。
プロセスマイニングは、DTOを実現する上で不可欠の機能(次項参照)を提供していることから、DTO市場においても高い存在感を示すのは当然でしょう。
DTOを実現する主要機能
当レポートでは、DTOを実現する主要機能として以下を示しています。
・包括的なデータマネジメント – Comprehensive Data Management
・プロセスのモデリングとビジュアル化 – Process Modeling and Visualization
・シミュレーション – Simulation
・高度な分析 – Advanced Analytics
・リアルタイムモニタリング – Real-Time Monitoring
・継続的なフィードバックと改善 – Continuous Feedback and Improvement
・各種システムとの統合と協調 – Integration and Collaboration
Process Mining trend – Global 2005-2021 by HSPI Process Mining: A Database of Applications 2021
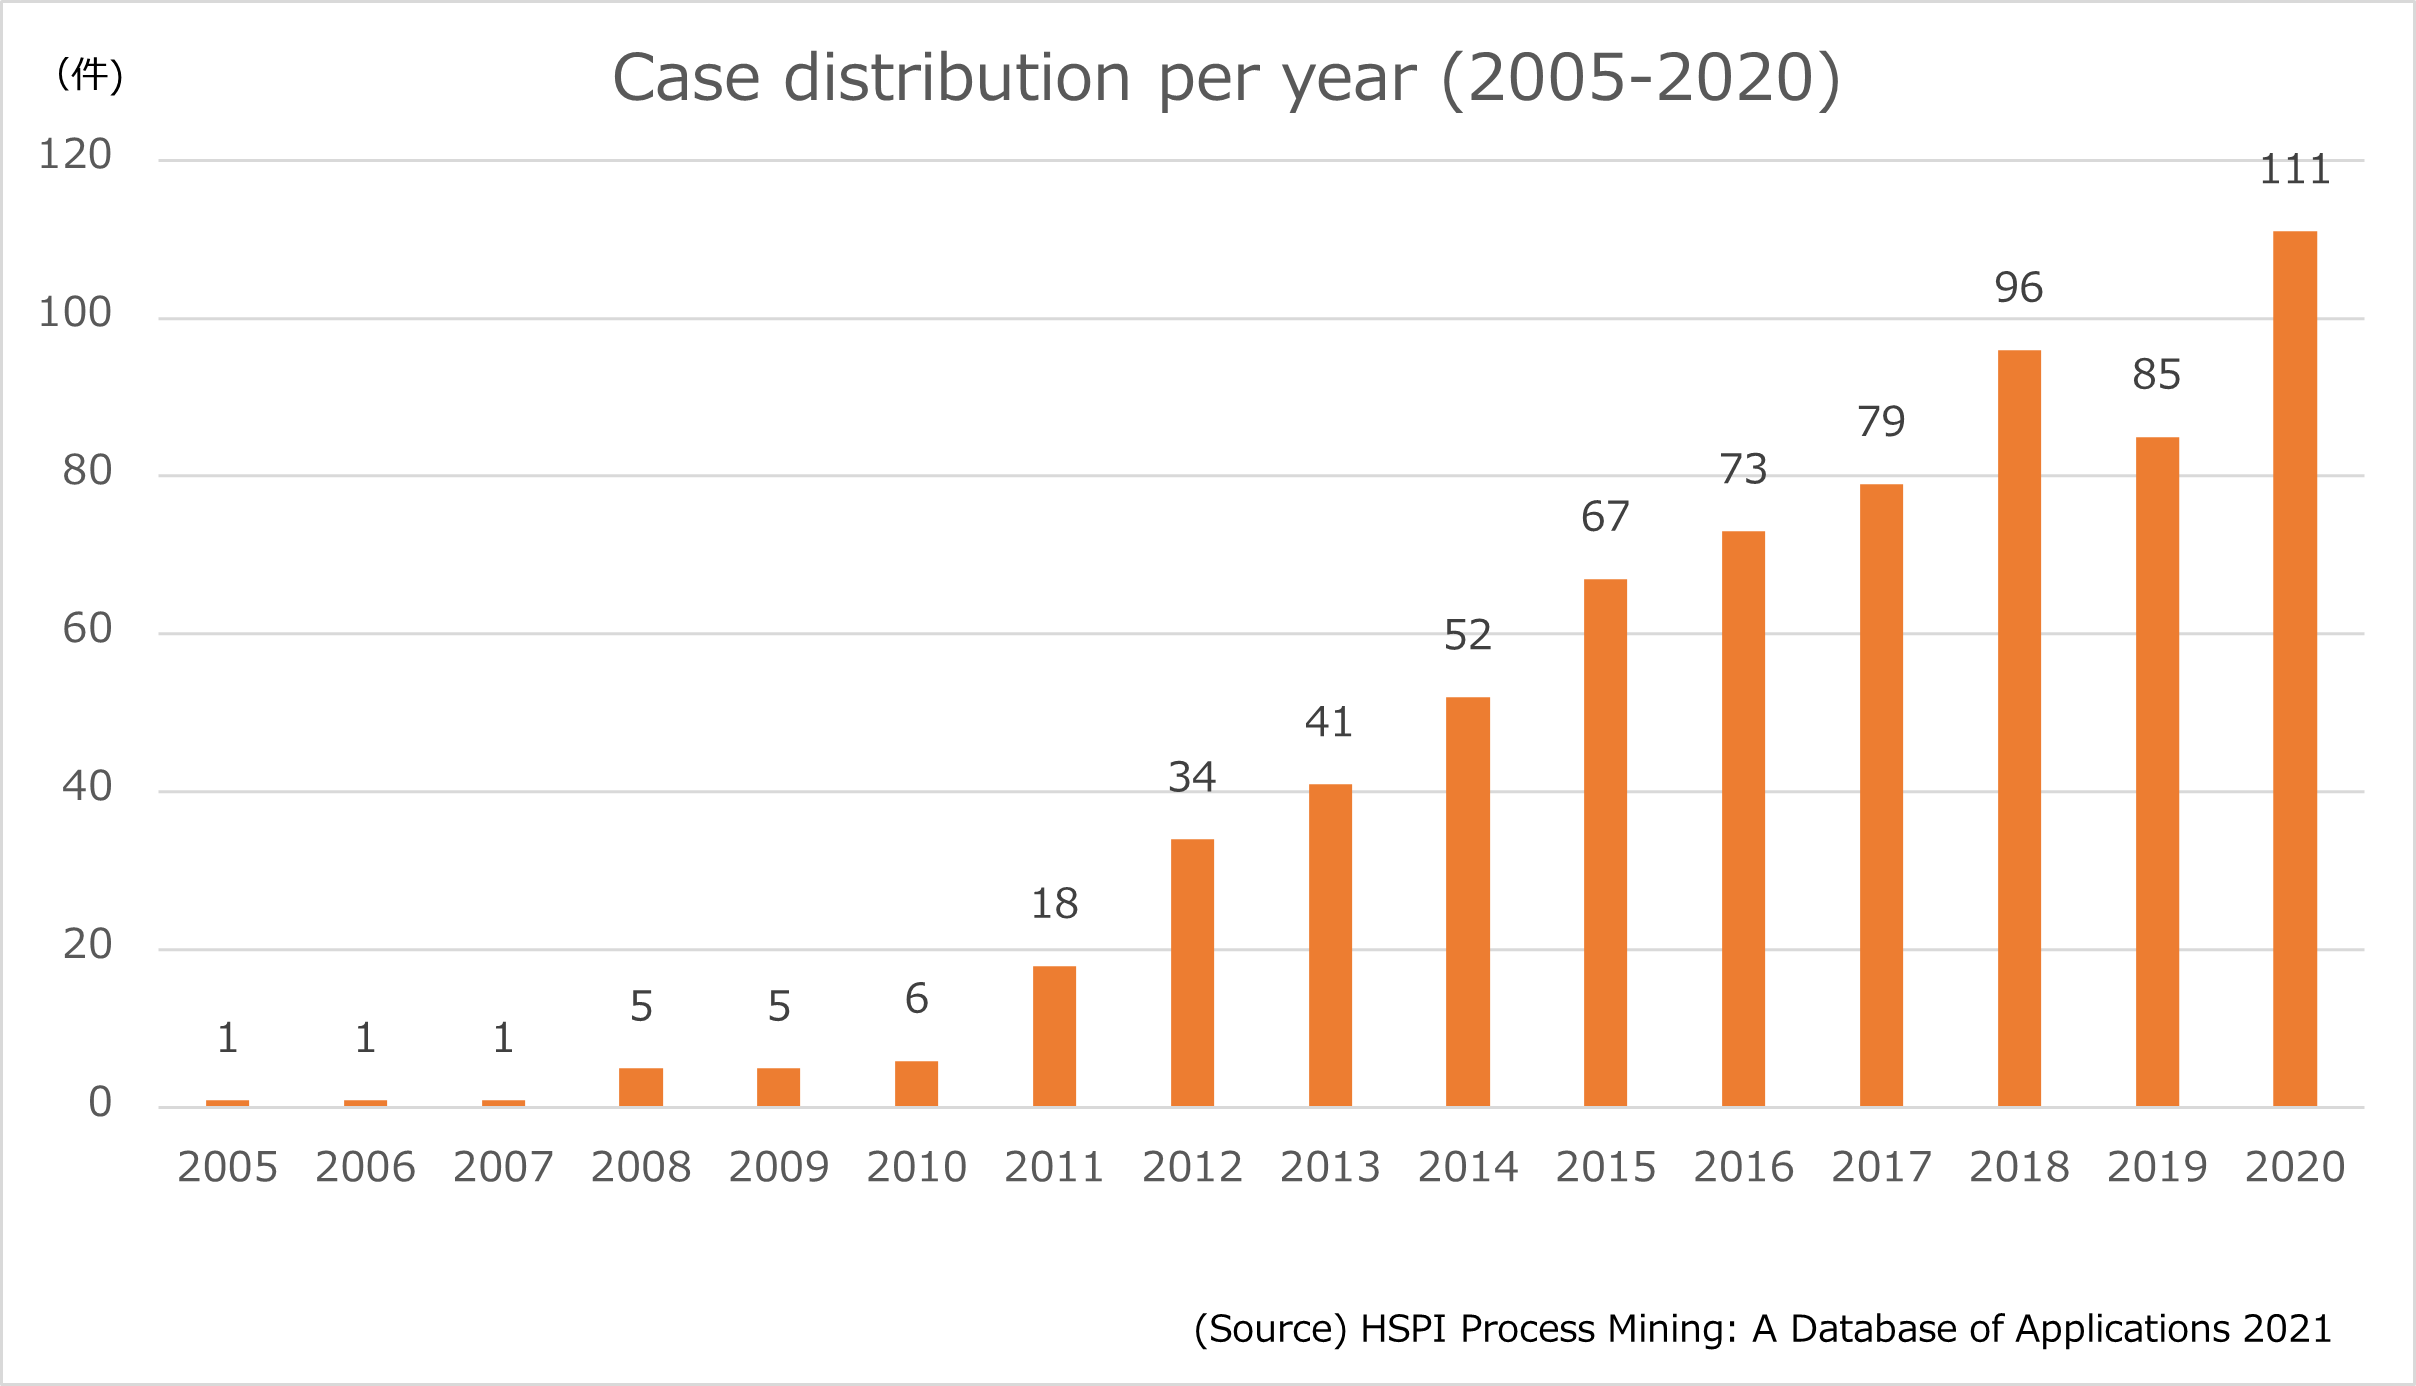
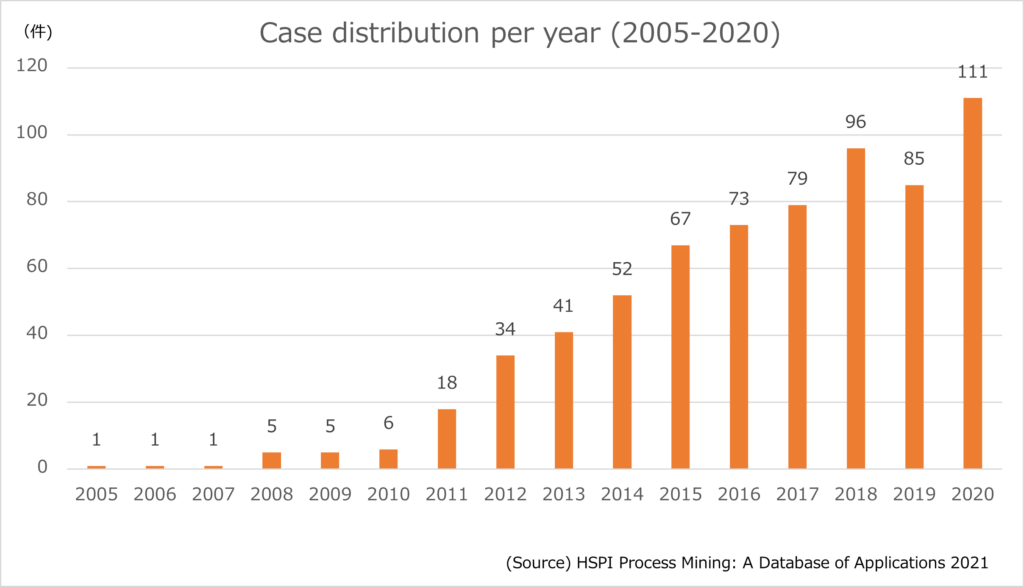
イタリアのITコンサルティングファーム、HSPIが2018年から毎年発行しているプロセスマイニング事例集の2021年版、「Process Mining: A Database of Applications 2021」が2021年1月27日に公開されました。
詳細はオリジナルのレポートをご覧いただくとして、当記事は全体概要としての統計的集計結果をご紹介します。なお、このレポートはプロセスマイニング導入に関わるコンサルティング会社やプロセスマイニングツールのベンダー企業などに案件情報提供を依頼した結果であり、市場全体を代表するものではありません。
プロセスマイニングプロジェクト件数年別推移
年別のプロセスマイニングプロジェクトの実施件数推移を見ます。2019年に報告件数が減少しましたが、2020年は100件を超え、導入企業が着実に増加していることがうかがえます。
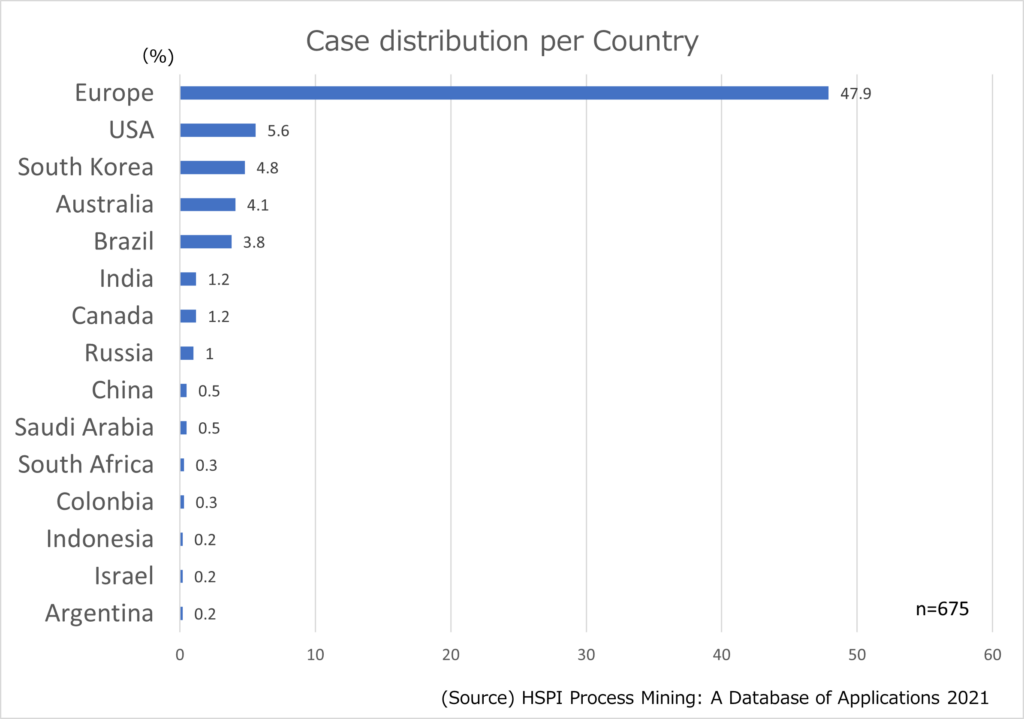
国別プロジェクト件数(構成比)
次に、過去の全案件について国別のプロジェクト件数の構成比を見ます。
プロセスマイニングは1999年にオランダで誕生し、ヨーロッパ各国で研究、および活用がすすんできたこともあり、ヨーロッパが全体の約半数を占めています。
次いで、米国、韓国、オーストラリアと続いています。
米国でのプロセスマイニング普及は日本とほぼ同時期の2018年ころからですが、良いものには躊躇せず飛び付く米企業らしく、急速に普及が進んでいることが推測できます。
韓国では、韓国企業、Puzzle Dataが独自開発したプロセスマイニングツールが市場をほぼ独占しており、積極的にマーケティング&セールス活動を行っていることから、普及が進んでいるようです。
オーストラリアでは、クィーンズランド大学はじめ、プロセスマイニング研究が盛んで、近年はオープンソースツール、Apromoreが商用サービスを開始したことを背景に着実に導入が進んでいます。
日本の案件は最新版でも含まれていませんが、おそらく2020年だけで数十社がPoC、または本格導入したと推測され、仮に本調査に協力したとしたら上位に位置してくるのは間違いないでしょう。
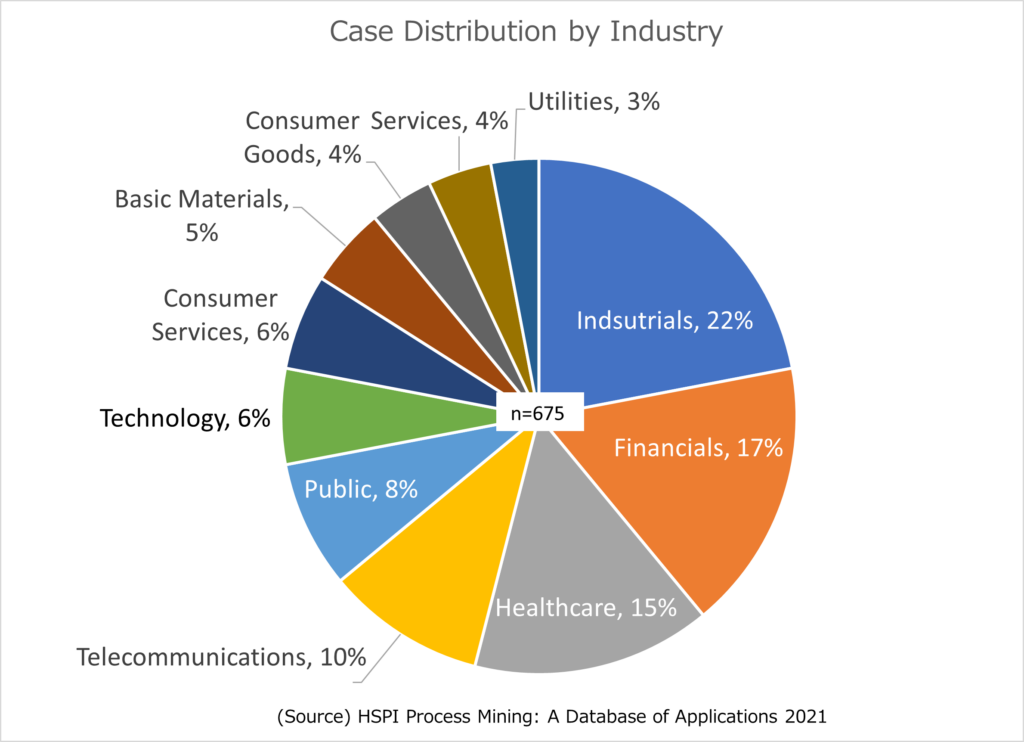
産業別プロジェクト件数(構成比)
産業別にみてプロセスマイニング導入が多いところはどこでしょうか。
以下の円グラフでおわかりのように、「Industrals」が22%と最も多く、次いでFinancialsが17%、「Healthcare」15%、「Telecommunications」10%と続いています。
「Industrials」には、Aerospace & Defence, Automotive & Parts, Construction & Materials, Electronics, General Industrials, Industrial Engineering , Logisticなどの業種が含まれていますが、大規模組織で、複雑なプロセスを抱える企業のプロセスマイニング導入が進んでいることがうかがえます。
当記事は、Tartu大学教授、Marlon Dumas氏の掲載許諾を得て日本語に翻訳したものです。日本語での理解がしやすいよう、多少補足・意訳している箇所があります。日本語版の文責はすべて松尾にあります。
Marlon Dumas氏は、BPM(Business Process Management)、Process Miningの研究者として世界的に著名です。オープンソースのプロセスマイニングツール、「Apromore(アプロモーレ)」を開発販売するApromore Pty Ltdの共同創業者でもあります。
また、世界の多数の大学において、BPMの教科書に採用されている『Fundamentals of Business Process Management』の共著者です。なお、『Fundamentals of Business Process Management』の日本語版が2021年中に刊行予定です。
Process Mining in 2021 and Beyond
– Marlon Dumas, Professor at University of Tartu | Co-founder at Apromore
過去10年間で、プロセスマイニングはビジネスプロセスを分析し、改善するための主流のアプローチとなりました。何百ものケーススタディが文書化され、また数千もの成功事例があり、プロセスマイニングは今やBPM(ビジネスプロセス管理)分野の不可欠な一部となっています。
同時に、プロセスマイニングはダイナミックで急速に進化している分野であり、今後もさらなる進化が期待されています。過去10年間は、可視化とダッシュボード(自動プロセス発見、パフォーマンスダッシュボード、アニメーション)に重点が置かれてきました。今後数年間のうちに、プロセスマイニングは、AIベースのプロセス最適化の領域へと進化していくでしょう。
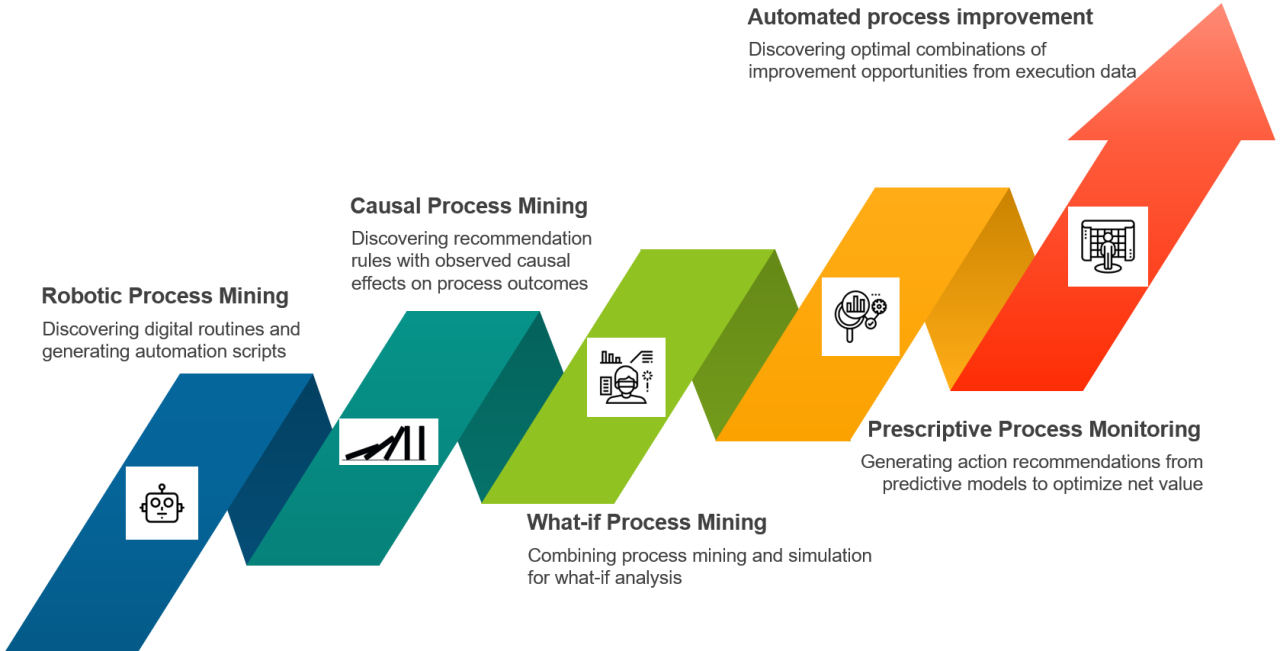
私は、2021年には5つのトレンドが到来すると考えています。
トレンド1. ロボティック・プロセスマイニング
ロボティック・プロセス・マイニングは、デジタル・ワーカーが日常業務で行う反復的な定型作業を発見することに焦点を当てたプロセス・マイニングの新しいサブフィールドです。
定型業務の例としては、1つまたは複数のドキュメントからのデータをオンラインフォームに入力したり、電子メールの添付ファイルから内部情報システムにデータをコピーしたりすることが挙げられます。
ロボティックプロセスマイニングの出発点はUI(ユーザーインタラクション)ログ(日本では「PC操作ログ」とも言う)です。業務従事者と様々なアプリケーションや情報システムとの間のユーザーのインタラクション(操作)を記録したものです。
ロボティック・プロセス・マイニング・ツールは、複数の作業者が一定期間にわたって生成したUIログを分析し、頻繁に繰り返された手順の流れ(シーケンス)を発見します。これらは「デジタル作業ルーチン」と呼ばれています。各ルーチンは分析され、例えばRPA(Robotic Process Automation)のボットや、アプリケーションオーケストレーションスクリプトを介して自動化できるかどうかを判断します。
ロボット・プロセス・マイニングの究極の目的は、作業者を付加価値のないルーチンから解放し、顧客にとって重要なことに集中できるようにすることです。このアニメーションは、ロボットプロセスマイニングのゴールを簡潔に説明しています。
トレンド2. Causal(因果)プロセスマイニング
因果プロセスマイニングは、ビジネスプロセスの実行ログから因果関係を発見し、それを定量的に把握しようとするプロセスマイニングの新たなサブフィールドです。
このような因果関係は、プロセス管理者がビジネスプロセスの改善機会を特定するのに役立つかもしれません。例えば、注文から現金化までのプロセス(O2C)のイベントログに対するプロセスマイニング分析結果から、顧客が東南アジア出身の場合、アクティビティAをワーカーXに割り当てるか、あるいは、アクティビティBの前にアクティビティAを実行すると(その逆ではなく)、この顧客が満足する確率が10%上がる、といった因果関係を発見することができます。
因果プロセスマイニングの目的は、特定のパフォーマンス指標の点で違いをもたらす介入*を特定することです。因果プロセスマイニングの詳細については、こちらの記事をお読みください。
*介入とは、プロセスのパフォーマンスを向上させるために行う具体的な対応策を意味している。因果関係を明確にすることにより、どんな介入が効果的であるかを特定することができる(松尾注)
トレンド3. What-if(もしも)プロセスマイニング
What-if(もしも)プロセスマイニングは、イベントログを使用して、ビジネスプロセスに対する1つ以上の変更が与える影響を理解するための方法です。
従来のプロセスマイニング手法は、「現在のプロセスのボトルネックは何か」、「現在のムダの発生源はどこか」、「リワーク(繰り返し業務)のループはどこか」などの「現状」分析の質問に焦点を当てています。
対照的に、What-ifプロセスマイニングでは、次のような質問に対応します。「来月、顧客からの注文数が2倍になったらどうなるだろうか」、「Covidの影響で、従業員(の生産性)が10%が遅くなったらどうなるだろうか」、「あるタスクを90%自動化すると、待ち時間や処理費用がどれくらい削減されるだろうか」などです。
What-ifプロセスマイニングの要となるのは、データドリブンのプロセスシミュレーションです。すなわち、実行データに基づいて、再現度の高いプロセスシミュレーションモデルを自動的に発見する機能です。従来、プロセスシミュレーションは、確率分布や統計解析に関する高度な専門知識を必要とし、非常に時間のかかる作業でした。
データドリブンのシミュレーションは、シミュレーションモデルを自動的に発見、調整、検証することで、この作業を自動化し、観測されたプロセスを忠実に再現することを可能にします。ここ数年は、イベントログからBPMNのシミュレーションモデルを検出するオープンソースのツールセット「Simod」をはじめとするデータドリブンのシミュレーションツールが登場しています。2021年に向けて、この分野ではさらに多くの開発が行われることでしょう。
トレンド4. 処方的プロセスモニタリング
プロセスマイニングに使用するものと同じイベントログは、以下のようなプロセスの結果を予測するための「機械学習モデル」を訓練することにも使用できます。
・実行中のプロセスインスタンスは時間通りに完了するのか、それとも遅れるのか
・顧客は注文を受けて満足するのか、製品を返品するのか
・サプライヤーは請求書を時間通りに支払うのか、それとも多少の遅延があるのか
予測プロセスダッシュボードを生成するツールはいくつかありますが、その中にはNirdizatiのようなオープンソースのツールも含まれています。このような予測には、間違いなく多くの潜在的なビジネス価値があります。これらのツールを使うことで、運用管理者や業務従事者は問題の発生を確認し、予防措置を取ることが可能になります。
ただし、現実には、予測監視ダッシュボードだけではほとんど役に立ちません。確かに、未完了の注文の10%が、遅延や不良品、製品間違いなど、何らかの形で顧客からのクレームにつながる可能性はわかります。しかしながら、それは私たちがそれについて、「いつ何をすべきか」を教えてくれません。すなわち、そうした問題を防ぐために、ビジネス価値を最大化しつつ、リソースをどのように配分すべきなのか?予測に基づいていつ行動すべきか?を教えてくれるわけではないのです。
処方的プロセスモニタリングは、プロセスのパフォーマンス指標を最適化する施策(「介入」と呼ぶ)を推奨するために、予測的プロセスモデルを利用する新しい技術です。処方箋的プロセスモニタリングはコストを重視します。例えば、顧客への納品の迅速化や優先順位付けのコストと、特定の顧客への早期納品のメリット(他の納品を犠牲にする可能性もあります)とのトレードオフを最適化します。また、経営者による予防措置のコストと、全体的な利益との間のトレードオフを最適化します。
処方分析技術は、eコマースの分野で高いレベルの成熟度に達しています – Youtubeなどの大手メディアサイトで使用されているレコメンド(推奨)システムを考えてみてください。私は、この技術の一部が今後数年のうちに、処方的プロセスモニタリングのエンジンに組み込まれることを予想しています。
トレンド5. 自動化されたプロセス改善(AutoPI)
現在のプロセスマイニングの方法は、主に可視化とダッシュボードに基づいています。これらの方法では、プロセス内の問題点とその解決方法を特定するためには、アナリストや専門家が一連の可視化をナビゲートする必要があります。
ビジネスプロセスの可視化は、問題(ボトルネックや繰り返し業務など)があることを示していても、それに対処する方法を教えてくれるわけではありません。たとえば、リソース(担当者)の再配置や再教育をすべきか、いくつかのタスクやハンドオフ(部門間にわたる業務の受け渡し)を自動化すべきか、どのタスクを自動化すべきか、タスクの実行方法を変更すべきか、タスクを早めに実行すべきか、それともプロセスの後半に延期すべきか、また、プロセスの早い段階で顧客にリマインダーを送るべきか、などを教えてはくれません。
自動化されたプロセス改善(AutoPI)は、ビジネスプロセスをどのように変更すべきかについての幅広い選択肢を自動的に探索します。そして、欠陥率、コスト、手作業やスループットなどの1つ以上のプロセスパフォーマンス指標を最適化するための変更の組み合わせを発見するための発育途上の技術です。
AutoPIはまだ初期段階にありますが、今後1~2年でいくつかのプロトタイプやパイロットケースが登場し、2020年代半ばには成熟したツールが登場することを期待しています。
結 論
上記は、来年のプロセスマイニングの分野で期待されるワクワクする展開のほんの一部に過ぎません。もちろん、ICPM’2020カンファレンスのインダストリーパネルで議論されたように、今後数年間で取り組むであろう課題は他にもあります。
プライバシー保護のプロセスマイニング、クロスプロセス分析、イベントログの品質の自動検証と強化などの技術的な課題に取り組むために、いくつかの進歩があることは間違いありません。また、プロセスマイニングの戦略的位置づけやガバナンスの分野では、プロセスマイニングの成熟度モデルや、「全社的プロセスコントロールルーム」のような管理概念の出現など、問題が発生したときに、反応的にプロセスマイニングの調査を開始するのではなく、プロセスが全体的かつ先を見越して管理されるような、多くの発展が期待されています。
あなたがプロセスマイニングの世界に入れば、さらなる楽しみがあるでしょう。また、プロセスマイニングを実践に取り入れることを躊躇しているBPMの実務家にとっては、成熟した現時点でのプロセスマイニングと、今後の多くの新たな開発の両方を活用することができる今が、プロセスマイニングをBPMに統合する絶好のチャンスでしょう。
免責事項、承認およびライセンス
この作品は、タルトゥ大学の教授として書かれたものです。私の研究は、欧州研究評議会(PIXプロジェクト)とエストニア研究評議会から資金提供を受けています。また、オープンソースのプロセスマイニングソリューションを提供するApromoreの共同設立者でもあります。後者の所属に偏らないようにしています。
この記事はクリエイティブ・コモンズ 表示一般ライセンス CC-BY 2.0 の下でライセンスされています。
Marlon Dumas – Professor at University of Tartu | Co-founder at Apromore

Japanese Myths of Process Mining
English follows Japanese. Befor proofread.
プロセスマイニングに対する関心が生まれたのは、日本では2018年後半から。以来、約2年が経過して、プロセスマイニングへの関心はさらに高まっており、大手企業を中心に、プロセスマイニングを導入して一定の成果を出している企業が増えています。具体例としては、通信キャリア大手のKDDI、重工業大手のIHI、物流大手の日立物流、金型商社大手のミスミなどが積極的にプロセスマイニングを活用しており、その取り組み事例が各所で報告されています。
ただ、いまだプロセスマイニングに対して懐疑的な日本企業も少なくなく、いわゆる日本特殊論ともいえる神話が語られている状況も見受けられます。
当記事は、日本企業が抱きがちな、プロセスマイニングについての2つの神話を打ち砕くことを目的としています。
神話1 日本企業のシステムは複雑すぎてプロセスマイニングでは分析できない
日本企業はSAPのようなパッケージをデフォルトのまま採用することが少なく、現状業務手順に合わせて大幅なカスタマイズを行ったり、ゼロからスクラッチで開発することが多いのは確かです。さらに、業務内容の変化に合わせて改修を重ねてきており、システム構成が非常に複雑怪奇になっていることも少なくありません。
このため、イベントログも複雑であり、プロセスマイニング分析は通用しない、と思い込んでいる方がいます。しかし、これは幻想です。
プロセスマイニング導入で先行する欧州の企業でも、老朽化し、複雑化したレガシーシステムを未だ運用しているところも多いのです。そうしたシステムから抽出されたトランザクションデータは確かにクオリティは高くなく、プロセスマイニング分析に堪えるイベントログへと整形するための工数は嵩みます。
しかし、決して不可能ではなく、美しいプロセスモデルは描けないとしても、複雑怪奇な現行システムの概要を把握することは可能であり、プロセスマイニングを起点として、より優れた業務プロセスの設計とそれを支える業務システムの要件定義へと駒を進めていくことができます。
真実:イベントログがなんらか存在するかぎり、どんな複雑なシステムであったとしても、プロセスマイニングは実行可能です。
神話2 各種紙の書類を処理する手作業やエクセル操作など、システム上で行わない業務が多いのでプロセスマイニングは意味がない
手作業やエクセルなど、システム外で行われる業務が多いのもまた、日本企業に限ったことではありません。IT調査会社のフォレスターの最新調査によれば、欧米企業の実に7割が業務においてなんらかの手作業を行っていると回答しています。
紙の伝票処理など、手作業部分はデジタルデータとして捕捉ができず、プロセスマイニングではもちろん分析対象とはできません。エクセルなどのオフィススイートの操作も、トランザクションデータとして自動的に記録されるものではありません。
しかし、手作業はOCRなどを用いることで電子化されたり、ワークフローに組み込むことによって業務の足跡が残る割合も高くなってきました。また、エクセル操作などは、タスクマイニングによって、PC操作ログとしてデータ捕捉が可能です。
このように、デジタル化の進展によって、プロセスマイニング分析が容易に実行できる環境が整いつつあるのです。
また、手作業やPC操作が多く含まれる業務プロセスであったとしても、業務システムが活用されていれば、節目のアクティビティに基づくプロセスモデルは描写可能であり、どこに非効率性やボトルネックが存在するかを発見することは可能です。
そして、プロセスマイニングで発見された非効率な箇所、ボトルネックは、手作業やエクセル操作が行われていることが多く、プロセスマイニングの結果に基づく改善施策として、手作業の電子化やワークフローシステムによる標準化が推進されます。このことがさらにプロセスマイニング分析の有効性を高めるという良循環が発生するのです。
真実:手作業やエクセルなどの操作が含まれる業務に対するプロセスマイニングも十分な成果を導けます。
Japanese myths of Process Mining
Interest in process mining was born in Japan in late 2018. About two years have passed since then, and interest in process mining has grown even more, with an increasing number of companies, especially major corporations, introducing process mining and achieving a certain level of success.
For example, KDDI, a major telecommunications carrier, IHI, a major heavy industry company, Hitachi Transport System, a major logistics company and MISUMI, a major mold trading company, are actively using process mining, and use cases of their efforts are being reported.
However, there are not a few Japanese companies that are still skeptical about process mining, and it can be seen that there are some myths that can be called Japan-specific myths.
This article aims to debunk two myths that Japanese companies tend to hold about process mining.
Myth 1: Japanese companies’ systems are too complex to be analyzed by process mining
It is true that Japanese companies rarely adopt packages like SAP as the default, and they often perform extensive customization to match current business procedures or develop from scratch. In addition, it is not uncommon for the system configuration to be very complex and bizarre, as it has been repeatedly modified in response to changes in business operations.
For this reason, some people assume that the event log is also complex and that process mining analysis will not work. However, this is an illusion.
Many European companies, which are leading the way in the adoption of process mining, are still running legacy systems that have grown in age and complexity. The transaction data extracted from such systems is certainly not of high quality, and it takes a lot of man-hours to format the data into an event log that is suitable for process mining analysis.
However, it is not impossible, and even if it is not possible to draw a beautiful process model, it is possible to get an overview of the complexity of the current system, and, using process mining as a starting point, to design better business processes and define requirements for the supporting business system.
Reality: As long as there is some kind of event log, process mining is feasible for any complex system.
Myth 2: There are many tasks that are not performed in the system, such as manual processing of various paper documents and Excel operations, so process mining is useless.
The fact that much of the work is done outside the system, such as by hand or in Excel, is not limited to Japanese companies; a recent survey by Forrester, an IT research firm, found that a whopping 70 percent of U.S. and European companies do some kind of manual work in their operations.
The manual part, such as processing paper slips, cannot be captured as digital data and cannot be analyzed by process mining, of course. Even operations in office suites, such as Excel, are not automatically recorded as transactional data.
However, manual operations can be digitized by using OCR and other tools, or incorporated into workflows to leave a high percentage of digital footprints. In addition, Excel operations, for example, can be captured as a PC operation log or user interaction log by task mining.
Thus, with the advancement of digitalization, an environment is being created in which process mining analysis can be easily performed day by day.
In addition, even if a business process involves a lot of manual and PC operations, if the business system is used some part of it, it is possible to describe a process model based on milestone activities and discover where inefficiencies and bottlenecks exist.
And the inefficiencies and bottlenecks discovered by process mining are often manual operations or Excel operations, and as improvement measures based on the results of process mining, digitization and digitalization of manual operations and standardization through workflow systems are promoted. This creates a virtuous circle that further increases the effectiveness of process mining analysis.
Reality: Process mining for operations that involve manual operations and Excel can also lead to satisfactory results.
Will Process Mining tool and BI tool be amalgamated?
English follows Japanese. Before proofread.
プロセスマイニングツールとBIツールは融合するか?
その答えはイエスです。すでに融合が始まっています。
具体的な動きとしては、Power BIのアドオンとして「PAFnow」というプロセスマイニングツールが提供されています。同様に、Qlikのアドオンとしては「MEHRWERK ProcessMining」が提供されています。
一方、プロセスマイニングツールも、イベントログからプロセスモデルを自動的に作成する「プロセス発見」をはじめとするプロセスマイニングの標準機能に加えて、「ダッシュボード機能」を充実させてきていますが、このダッシュボード機能はBIツールが提供する機能水準に近付きつつあります。
さて、プロセスマイニングツール、BIツールのどちらも、企業・組織運営に関わる様々なデータを取り込んで、様々な切り口で数値を演算し、その結果を表やグラフなどでビジュアルに提示するという点は同じです。
プロセスマイニングツールとBIツールの決定的な違いは、演算結果をどのように解釈し、活用できるか、という点にあります。
具体的には、以下のように説明できます。
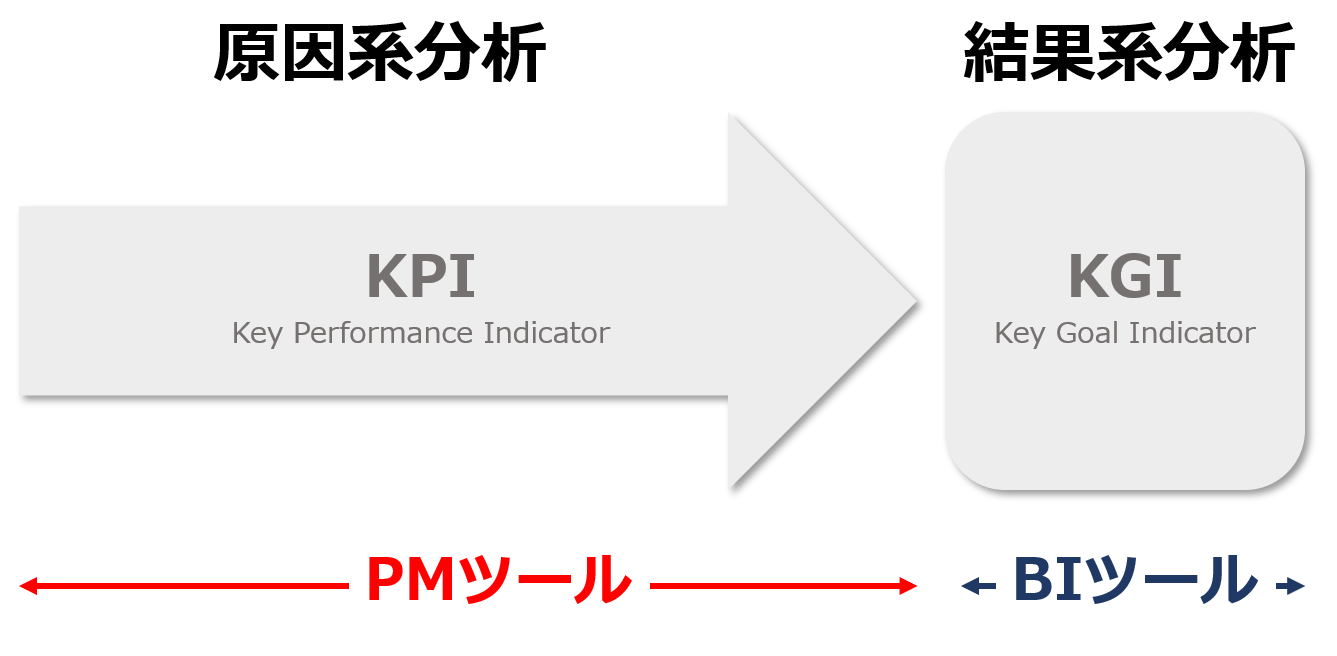
●プロセスマイニングツールが提示する演算結果
価値を生み出すアクティビティ(プロセス)のパフォーマンス=原因指標である。すなわち、プロセスマイニングツールがカバーするのは主に、KPI(Key Performance Indicator)である。
たとえば、保険会社の保険金請求処理プロセス(保険加入者からの保険金請求~保険金支払い)であれば、プロセスマイニングツールで分析することによって、プロセスに含まれるアクティビティごとの処理案件数や、処理に要した総所要時間(スループット)、処理コスト、担当者数などを算出できる。
また、プロセスマイニングならではのプロセス発見機能によって、業務手順を自動的にフローチャートとして描き出し、プロセスのどの部分にボトルネックや非効率な繰り返し作業が発生しているかを特定できる。
このように、価値を生み出すアクティビティ、すなわち原因系データを分析することで、さらに価値を高めたり、あるいはコストを削減するための業務プロセス改善施策へとつなげることができる。
BIツールが提示する演算結果
生み出された価値(売上や利益など)の大きさ=結果指標である。すなわち、BIツールがカバーするのは、KGI(Key Goal Indicator)である。
BIツールでは、企業活動の結果としての売上や利益、市場シェアなどを主に算出し、事業部別、エリア別、製品別などの各種次元(ディメンジョン)で多面的な分析が可能である。
BIツールでは、どの事業部、あるいはエリアが優れた(劣った)結果を残しているか、という判断を行うことはできるが、なぜ結果が優れているか(劣っているか)という原因を推測することはできない。そもそも、結果につながる原因系データを分析対象とはしていないためである。
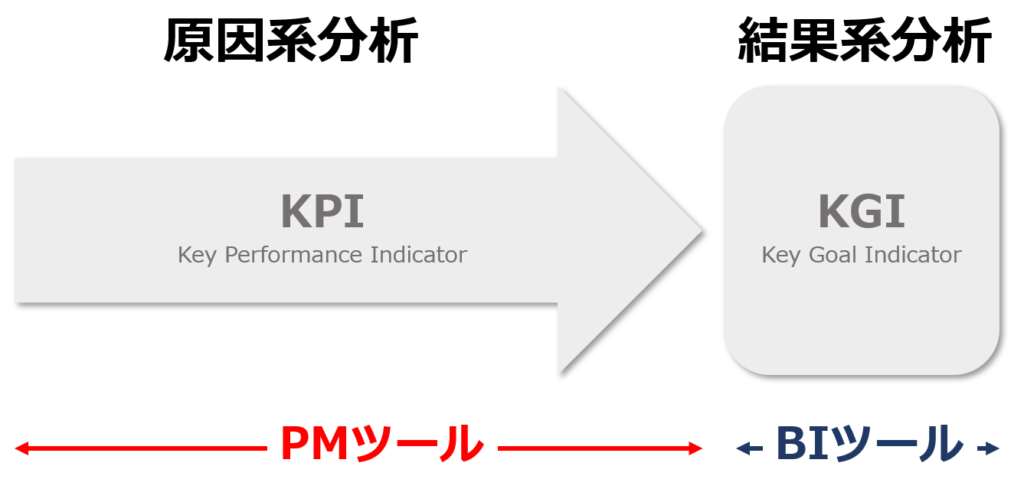
以上ご説明したように、両者の違いをまとめると、BIツールは、期末の通信簿のようなものであり、最終的な評価を下し、また次期のKGIの目標設定に役立てるもの。一方、プロセスマイニングツールは、期中の細かいパフォーマンスを分析して、KGIの目標達成のためにどのように改善すべきかを検討するために役立てるもの、と言えるでしょう。
なお、データの分析方法について、最近新たに生じてきたもうひとつの違いがあります。
BIツールは分析期間全体を対象とした過去データのスナップショットの数値を算出するのみであるのに対し、プロセスマイニングツールは、現在は知っている案件のデータを逐次分析するリアルタイムモニタリングを行う機能が付加されてきているということです。
企業・組織運営の状況を継続的に振り返り、改善すべき点は改善し、目標達成を確実にするためには、BIツールによるKGI評価とプロセスマイニングツールによるKPI評価の両方を併せて行うことが不可欠です。
現状は、両者のツールを組み合わせて活用する企業が増えていますが、冒頭に述べたように、プロセスマイニングツールとBIツールの境界はぼやけつつあり、将来的には融合して一体的なツールとして提供されていくことになると思われます。
Will Process Mining tool and BI tool be amalgamated?
The answer is yes. The integration has already begun.
In terms of specific developments, a process mining tool called “PAFnow” is available as an add-on for Power BI. Similarly, “MEHRWERK ProcessMining” is offered as an add-on for Qlik.
On the other hand, process mining tools have also been enriching their “dashboard features” in addition to the standard features of process mining, such as “process discovery” which automatically creates a process model from the event log, but this dashboard feature is now close to the level of functionality provided by BI tools.
By the way, both process mining tools and BI tools are the same in that they take in various data related to corporate and organizational management, calculate numbers from various angles, and present the results visually in tables and graphs.
The decisive difference between a process mining tool and a BI tool is in how the calculation results are interpreted and utilized.
Concretely, we can explain as follows.
Calculation results presented by process mining tools
Process mining tools mainly look to performance of activities (processes) that create value = causals. In other words, process mining tools mainly cover Key Performance Indicators (KPIs).
For example, in the case of an insurance company’s claims processing process (from insurance claim to payment), process mining tools can analyze the number of cases for each activity in the process, the total time required for processing (throughput), processing cost, and the number of people in charge, and so on. In addition, the process discovery function can automatically draw a flowchart of business procedures to identify problems such as bottlenecks and inefficient repetitive tasks.
In this way, by analyzing activities that create value, i.e., causal data analysis, it is possible to link them to business process improvement measures to further increase value or reduce costs.
Calculation results presented by BI tools
BI tools mainly look at The size of value (sales, profit, etc.) generated = outcomes. In other words, BI tools cover KGI (Key Goal Indicator).
BI tool basically calculates sales, profit, market share, etc. as a result of corporate activities, and enables multifaceted analysis in various dimensions such as by division, area, and product.
BI tools can make judgments about which business units or areas are producing superior (or inferior) results, but they cannot infer the causes of why results are superior (or inferior). This is because it does not analyze causal data in the first place.
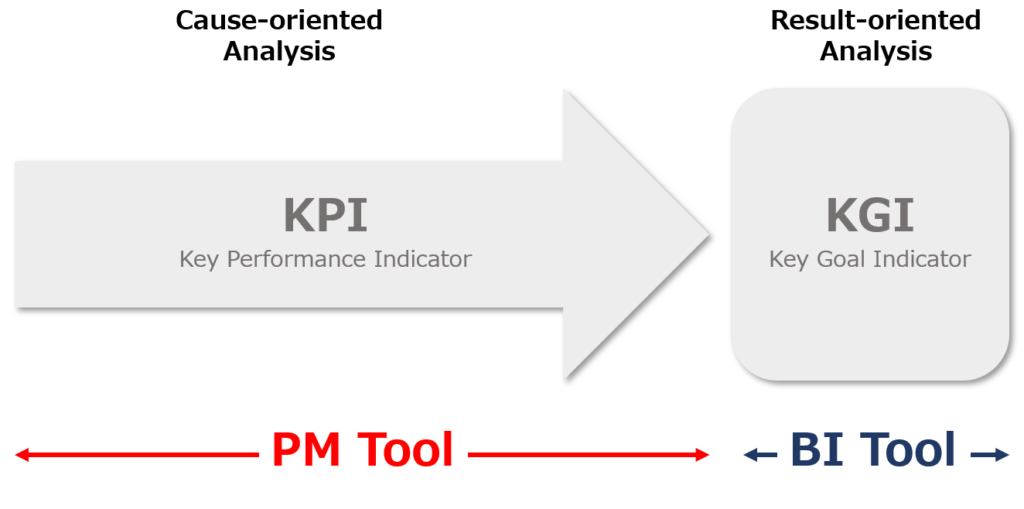
As explained above, to summarize the differences between them, BI tools are like a report book at the end of the term, and they are used to make final evaluations and to set new goals for theKGI in the next term. On the other hand, process mining tools are used to analyze performance in detail during the period and consider how to improve it in order to achieve the goals of KGI.
There is one more difference in the way data is analyzed that has recently emerged.
While BI tools only calculate a snapshot figure of historical data for the entire analysis period, process mining tools are now adding the ability to perform real-time monitoring that sequentially analyzes the data of the cases in the processing.
In order to continuously look back on the status of corporate and organizational operations, and to improve what needs to be improved, ensuring the achievement of goals, it is essential to combine KGI evaluation using BI tools and KPI evaluation using process mining tools.
Currently, more and more companies are using a combination of both tools, but as mentioned at the beginning of this article, the boundary between process mining tools and BI tools is blurring, and in the future, they will be provided as a combined tool.

Process Mining Case: Normative Process in the Braziian Executive Branch
ブラジル連邦共和国政府では、文字通り、官僚的な政府の業務プロセスについてプロセスマイニング分析を行い、その改善に取り組んでいます。
プロセスマイニング分析の対象となったのは、具体的には、大統領直轄の執行機関による立法プロセスです。ブラジルも多くの国と同様、三権分立制を採用しており、各種の法を制定する立法機関(Legislative Branch)、すなわち議会、および、法に基づく執行をつかさどる執行機関(Executive Branch)、そして法に基づく裁判を行う審判機関(Judicial Branch)、すなわち法廷の3つの機関で構成されています。
ただし、法律の起案は議会だけでなく、大統領直轄の執行組織である大統領府(英語ではCivil Hose of the Presidency fo the Republic)が、各省庁との連携のもと、憲法改正や、暫定法、大統領令などを起案することが可能です。この大統領府による立法プロセスに関わるイベントログに対してプロセスマイニングが実行されたというわけです。
プロセスマイニングが行われた目的は、重複する法制度が立案されてしまっていたり、立法にいたる手順に様々なボトルネックやリワーク(手戻り、繰り返し)が発生していたりする現状を明らかにし、より優れた立法プロセスへと改善する=近代化する(modernize)ことでした。
さて、大統領府における立法プロセスは、大きくは以下の4段階です。
1 法案の着想(Conception of the act)
↓
2 ステークホルダーとの議論(Discussion of the act)
↓
3 法案の取りまとめ(Consolidation of the act)
↓
4 法案への署名(Signature of the act)
法案の着想は、基本的には各省庁担当者が行います。各担当領域について法案を起案するにあたって現状分析・診断や代替案の検討、費用など、社会にとってどのような現実的な結果がもたらされるかが検討されます。
ステークホルダーとの議論は、起案された法案に関わる様々なステークホルダー(利害関係者)のすり合わせを行う段階です。ステークホルダーには、法案の内容によって、市民、企業、議員、外国人などが含まれます。
法案の取りまとめは、関係各所、ステークホルダーとの議論を踏まえ、なんらかの合意が得られた内容にまとめあげる段階です。そして、まとめられた法案はまず、公式書類を収録するシステム(Sidof)に投入されます。その後、大統領府においては、電子情報システム(Sei!)上で法案が処理され、最終化されて大統領の署名を待つことになります。
法案への署名は、大統領の署名、および閣僚による投票が行われる段階です。
以上の立法プロセスは現実には非常に複雑なものであり、利用される情報システム、アプリケーションも複数存在します。例外的な処理も多く発生せざるを得ません。このため、プロセスマイニング分析を行うに当たっては、法案の着想段階やステークホルダーとの議論段階において、非公式にやりとりされたEメール受送信データは対象外とされました。
そして、一般的な立法プロセスを導出するために、次の2つの分析が可能になるようデータ前処理が行われています。
・省庁間の情報のやりとり、および大統領府へ提出される標準手順(Sidofシステム登録まで)
・大統領府内での内部処理(Sei!システムでの処理)
公式文書管理システムであるSidofに登録されている立法案件は合計9,906件(2010年10月1日~2018年3月12日)でした。うち2,964件の法令や暫定法が公布されていました。
この2964件の立法プロセスのプロセスマイニング分析結果からは様々なことが明らかになりました。まず、平均的な所要期間は、30週であること。また、プロセスのバリエーションは2,739に上っており、一番多いパターンで21案件しかなかったことです。要するに、標準的な手順は実質的に存在していないということです。
また、大統領府内での法案処理プロセスに用いられるシステム「Sei!」のデータ分析からは、ボトルネックの存在が示唆され、またそれに関わる主要なプレーヤーは、法令部門(Leagal Unit)、および政府方策部門(Government Policies Unit)の2部門であることも判明しました。
上記のような各種分析を踏まえ、次のような改善施策が講じられています。
・Sei!システムとSidofシステムの両方の機能を備え、かつ問題点を解消した新たなシステムのプロトタイプを作成し、立法プロセスの標準化を促進する
・マイクロソフトのSharepointやTeamsなどのコラボレーションツールを導入して、立案プロセスに関与する関係者の協働作業を円滑に行えるようにする
・内部の業務処理手順を再設計する
上記事例は、Case Study: Government Proess Mining in the Brazilian Executive Branch ( Fluxicon)のポイントを和訳したものです。詳細は同記事をお読みください。
Process Mining Case: O2C – Digital Fit Rate
Siemensでは、O2C(Order to Cash)、すなわち受注から入金までのプロセスの改善の取り組みにプロセスマイニングを活用し、「デジタルフィット率」という同社独自のKPIを開発し、グローバル規模での成果を積み重ねています。
従業員数38万人以上、総売上970億ドル(全社、2019年)のSiemensでは、当然ながらこれまでも様々なプロセス改善の取り組みが行われてきています。たとえば、ワークショップを開催して業務プロセスをマッピングするなどの方法が採用されてきています。
ただ、プロセス改善の取り組みは基本的に、一部の事業単位などを対象とするプロジェクトベースであり、マッピングなどの現状把握のため、現場を巻き込んみつつ多大な労力が必要な割に、改善成果が見えずらく、また他の部署や他国オフィスと改善の取り組み内容を共有したり、拡張したりすることが困難でした。
このような状況下、2016年、同社は「O2C」のコスト低減を目的としたプログラム、「Order Management for Tomorrow(OM4T)」を開始。コスト削減のために、主に販売業務を支えるバックオフィス業務の効率化や自動化を実現することを目指したのです。
同社の事業部門のひとつ、Digital Industriesで同プログラムを牽引したのは、Gia-Thi Ngyen氏 ( Head of Operational Excellence)と、彼がメンバーとして声をかけた、Franziska Bierack氏(Project Manager)と、Ines Korner氏(Project Manager)の3人のチームです。
FranZiskaとInesはどちらも、顧客からの注文を受け付ける部門に所属しており、エクセルでの作業など、バックオフィス業務における手作業(マニュアルアクティビティ)の多さに辟易していました。
さて、彼らは1年ほどの間に30以上の国の同事業部オフィスを訪問し、新たなプログラムの展開、浸透に従事しましたが、その際、重要なKPIとしてFranziskaが開発したのがデジタルフィット率(Digital fit rate)です。
デジタルフィット率は、以下に示したように、マニュアルアクティビティ数を受注アイテム数で割るだけのシンプルな数値です。
デジタルフィット率=マニュアルアクティビティ数÷受注アイテム数
デジタルフィット率は、マニュアルアクティビティ数が、受注アイテム数よりも多ければ1以上となり、逆に少なければ1未満となります。したがって、デジタルフィット率が1を下回って少なければ少ない数値であるほど、手作業が少なく効率的でコスト低減につながっていることになります。
デジタルフィット率が最も重要で”使える”指標としてSiemensで受け入れられたのは、シンプルでわかりやすいだけでなく、サブ的な指標である「自動化率」や「リワーク(繰り返し)率」も包含する指標だったことがあります。
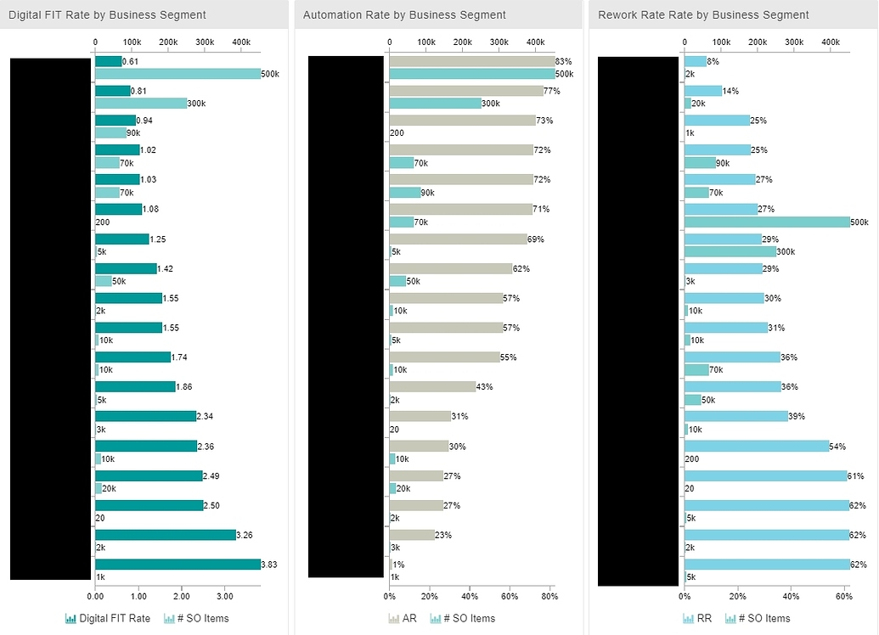
というのも、業務プロセスにおける自動化率は高ければ高いほど、言うまでもなくマニュアルアクテイビティは少ないことを意味します。また、リワーク率は、変更やミス発生による繰り返し、やり直しの割合を示していますが、これが少なければ結果的にマニュアルアクティビティ数が減少します。
こうして、デジタルフィット率をコア指標として、各種ダッシュボードで地域別、資材別、顧客別など様々な切り口での分析ダッシュボードを全世界で共有し、数値の改善度合いを見える化することで、各国とも積極的にプロセス改善に取り組むモチベーションも向上しました。
当プログラム展開の結果、自動化率は24%増加、手作業の手戻りは11%減少、実質的に1千万件以上の手作業が削減されたことになります。
参考資料等
『プロセスマイニングの衝撃』ラース・ラインケマイヤー編著、百瀬公朗訳、インプレス社
米ITアドバイザリ企業Gartnerが、2020年版となる『Market Guide for Process Mining』を2020年9月30日に公開しました。
当記事では主なポイントを速報としてお伝えします。
最新版では、プロセスマイニングができること(Capabilities)がバージョンアップされています。具体的には以下の10個です。これらは、各種プロセスマイニングツールがおおむね提供している、あるいは今後提供を目指していると思われる機能とも言えます。
・プロセス、例外処理、案件、そして従業員の関わりについて自動的にモデル(フロー図など)を作成
・カスタマーとのやりとり、カスタマージャーニーを自動的にモデル化すること、および関連分析
・適合性検査、およびギャップ分析
・プロセスモデルの強化(改善)のための追加的分析(属性を付加した分析)
・データ前処理、データクレンジング、ビッグデータへの対応
・意思決定支援を可能にする、KPIの継続的モニタリングのためのリアルタイムダッシュボード
・予測的分析、処方的分析、シナリオ検証、シミュレーション
・プロセスマイニングアプリケーションを作成できるAPIを提供し、また高度な分析と意思決定支援が行える、様々なプロセスにまたがるプロセスマイニング分析のプラットフォーム
・様々な異なるプロセス間のやり取りや、それら複数のプロセスが同じワークステーションや職場、デスクトップPCでどのように実行されているかの分析
・ユーザーインタラクションログ(PC操作ログ)に基づくタスクマイニング分析
また、Gartnerは、プロセスマイニングが採用されるメインドライバーとして以下の4つを挙げています。
・デジタルトランスフォーメーション – Digital Transformation
・人工知能(AI) – Artificial Intelligence
・タスクオートメーション – Task Automation
・ハイパーオートメーション – Hyperautomation
ハイパーオートメーションとは、ひらたく言えば、RPAなどを用いたタスクオートメーション、ワークフローやiBPMSによるプロセスオートメーション、そしてDigitalOpsによる業務オペレーション全体の自動化をチャットボット、スマーとスピーカー、AI、機械学習などの様々なテクノロジーも組み込みながら実現していこうとするものです。
標準的なプロセスマイニングのユースケースとしては以下の5つが挙げられています。なお、アルゴリズムとは、イベントログからプロセスモデルを自動的に描くために、プロセスマイニングツールに組み込まれているものです。
・アルゴリズムによるプロセス発見、分析によるプロセスの改善
・アルゴリズムによるプロセスの比較、分析、検証による監査、コンプライアンスの改善
・自動化の機会の発見と検証によるプロセス自動化の改善
・戦略と業務を結びつけ、柔軟な組織を生み出すことによる、デジタルトランスフォーメーション(DX)の支援
・アルゴリズムによるITプロセスの発見と分析に基づく、IT業務のリソース最適化の改善
2020年版で示されているプロセスマイニングの代表的ベンダー・ツールは以下の20種類です。
| ABBYY | Timeline |
| Apromore | Apromore |
| BusinessOptix | BusinessOptix |
| Celonis | Celonis Intelligent Business Cloud Platform |
| Cognitive Technology | myInvenio |
| EverFlow | EverFlow |
| Fluxicon | Disco |
| Integris | Explora |
| Lana Labs | LANA Process Mining (Magellanic), LANA Connect (Rockhopper) |
| Logpickr | Logpickr Process Explorer 360 |
| MEHRWERK | MEHRWERK ProcessMining (MPM) |
| Minit | Minit |
| Process Analytics Factory (PAF) | PAFnow |
| Process Mining Groups at TUE and RWTH | ProM, ProM Lite, RapidProM, PM4Py |
| Puzzle Data | ProDiscovery |
| QPR Software | QPR ProcessAnalyzer |
| Signavio | Signavio Process Intelligence |
| Software AG | ARIS Process Mining |
| StereoLOGIC | StereoLOGIC 2020 |
| UiPath | UiPath Process Mining, UiPath Task Mining |
レポート内容詳細は、『Market Guide for Process Mining』の原文を参照ください。