Will Process Mining tool and BI tool be amalgamated?
English follows Japanese. Before proofread.
プロセスマイニングツールとBIツールは融合するか?
その答えはイエスです。すでに融合が始まっています。
具体的な動きとしては、Power BIのアドオンとして「PAFnow」というプロセスマイニングツールが提供されています。同様に、Qlikのアドオンとしては「MEHRWERK ProcessMining」が提供されています。
一方、プロセスマイニングツールも、イベントログからプロセスモデルを自動的に作成する「プロセス発見」をはじめとするプロセスマイニングの標準機能に加えて、「ダッシュボード機能」を充実させてきていますが、このダッシュボード機能はBIツールが提供する機能水準に近付きつつあります。
さて、プロセスマイニングツール、BIツールのどちらも、企業・組織運営に関わる様々なデータを取り込んで、様々な切り口で数値を演算し、その結果を表やグラフなどでビジュアルに提示するという点は同じです。
プロセスマイニングツールとBIツールの決定的な違いは、演算結果をどのように解釈し、活用できるか、という点にあります。
具体的には、以下のように説明できます。
●プロセスマイニングツールが提示する演算結果
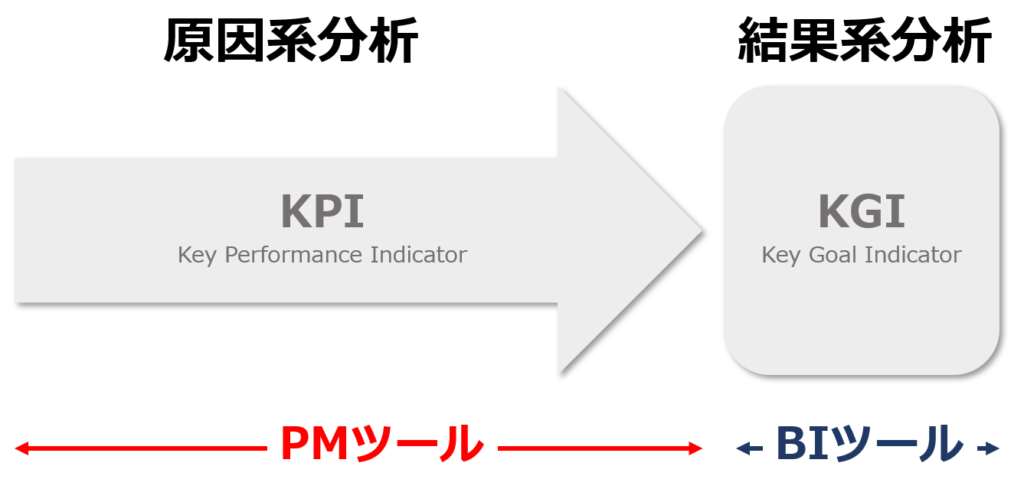
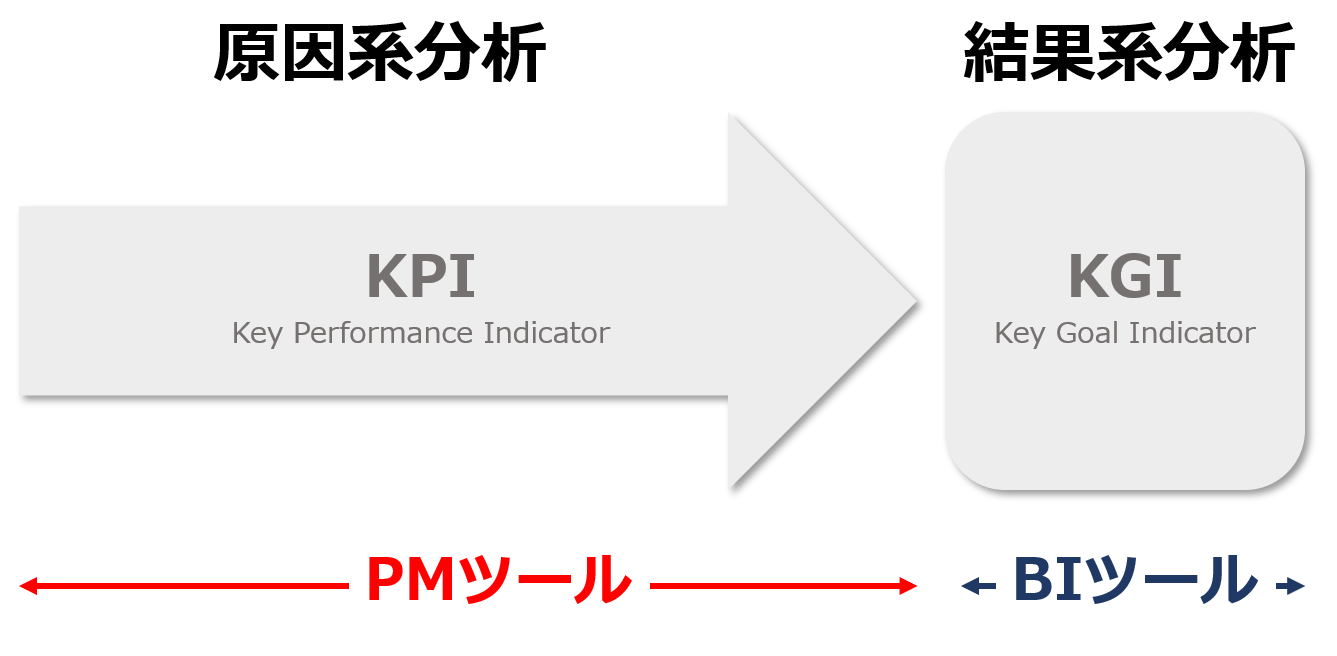
価値を生み出すアクティビティ(プロセス)のパフォーマンス=原因指標である。すなわち、プロセスマイニングツールがカバーするのは主に、KPI(Key Performance Indicator)である。
たとえば、保険会社の保険金請求処理プロセス(保険加入者からの保険金請求~保険金支払い)であれば、プロセスマイニングツールで分析することによって、プロセスに含まれるアクティビティごとの処理案件数や、処理に要した総所要時間(スループット)、処理コスト、担当者数などを算出できる。
また、プロセスマイニングならではのプロセス発見機能によって、業務手順を自動的にフローチャートとして描き出し、プロセスのどの部分にボトルネックや非効率な繰り返し作業が発生しているかを特定できる。
このように、価値を生み出すアクティビティ、すなわち原因系データを分析することで、さらに価値を高めたり、あるいはコストを削減するための業務プロセス改善施策へとつなげることができる。
BIツールが提示する演算結果
生み出された価値(売上や利益など)の大きさ=結果指標である。すなわち、BIツールがカバーするのは、KGI(Key Goal Indicator)である。
BIツールでは、企業活動の結果としての売上や利益、市場シェアなどを主に算出し、事業部別、エリア別、製品別などの各種次元(ディメンジョン)で多面的な分析が可能である。
BIツールでは、どの事業部、あるいはエリアが優れた(劣った)結果を残しているか、という判断を行うことはできるが、なぜ結果が優れているか(劣っているか)という原因を推測することはできない。そもそも、結果につながる原因系データを分析対象とはしていないためである。

以上ご説明したように、両者の違いをまとめると、BIツールは、期末の通信簿のようなものであり、最終的な評価を下し、また次期のKGIの目標設定に役立てるもの。一方、プロセスマイニングツールは、期中の細かいパフォーマンスを分析して、KGIの目標達成のためにどのように改善すべきかを検討するために役立てるもの、と言えるでしょう。
なお、データの分析方法について、最近新たに生じてきたもうひとつの違いがあります。
BIツールは分析期間全体を対象とした過去データのスナップショットの数値を算出するのみであるのに対し、プロセスマイニングツールは、現在は知っている案件のデータを逐次分析するリアルタイムモニタリングを行う機能が付加されてきているということです。
企業・組織運営の状況を継続的に振り返り、改善すべき点は改善し、目標達成を確実にするためには、BIツールによるKGI評価とプロセスマイニングツールによるKPI評価の両方を併せて行うことが不可欠です。
現状は、両者のツールを組み合わせて活用する企業が増えていますが、冒頭に述べたように、プロセスマイニングツールとBIツールの境界はぼやけつつあり、将来的には融合して一体的なツールとして提供されていくことになると思われます。
Will Process Mining tool and BI tool be amalgamated?
The answer is yes. The integration has already begun.
In terms of specific developments, a process mining tool called “PAFnow” is available as an add-on for Power BI. Similarly, “MEHRWERK ProcessMining” is offered as an add-on for Qlik.
On the other hand, process mining tools have also been enriching their “dashboard features” in addition to the standard features of process mining, such as “process discovery” which automatically creates a process model from the event log, but this dashboard feature is now close to the level of functionality provided by BI tools.
By the way, both process mining tools and BI tools are the same in that they take in various data related to corporate and organizational management, calculate numbers from various angles, and present the results visually in tables and graphs.
The decisive difference between a process mining tool and a BI tool is in how the calculation results are interpreted and utilized.
Concretely, we can explain as follows.
Calculation results presented by process mining tools
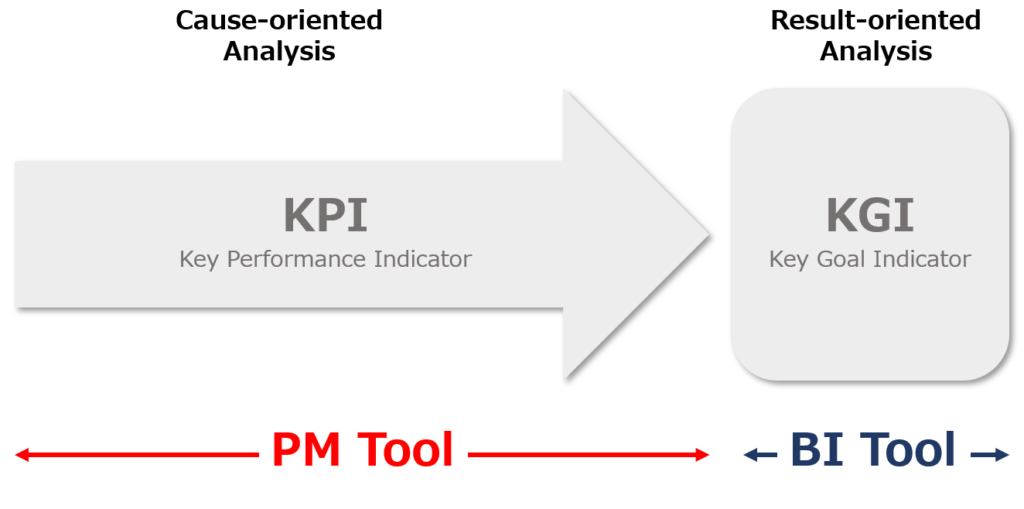
Process mining tools mainly look to performance of activities (processes) that create value = causals. In other words, process mining tools mainly cover Key Performance Indicators (KPIs).
For example, in the case of an insurance company’s claims processing process (from insurance claim to payment), process mining tools can analyze the number of cases for each activity in the process, the total time required for processing (throughput), processing cost, and the number of people in charge, and so on. In addition, the process discovery function can automatically draw a flowchart of business procedures to identify problems such as bottlenecks and inefficient repetitive tasks.
In this way, by analyzing activities that create value, i.e., causal data analysis, it is possible to link them to business process improvement measures to further increase value or reduce costs.
Calculation results presented by BI tools
BI tools mainly look at The size of value (sales, profit, etc.) generated = outcomes. In other words, BI tools cover KGI (Key Goal Indicator).
BI tool basically calculates sales, profit, market share, etc. as a result of corporate activities, and enables multifaceted analysis in various dimensions such as by division, area, and product.
BI tools can make judgments about which business units or areas are producing superior (or inferior) results, but they cannot infer the causes of why results are superior (or inferior). This is because it does not analyze causal data in the first place.

As explained above, to summarize the differences between them, BI tools are like a report book at the end of the term, and they are used to make final evaluations and to set new goals for theKGI in the next term. On the other hand, process mining tools are used to analyze performance in detail during the period and consider how to improve it in order to achieve the goals of KGI.
There is one more difference in the way data is analyzed that has recently emerged.
While BI tools only calculate a snapshot figure of historical data for the entire analysis period, process mining tools are now adding the ability to perform real-time monitoring that sequentially analyzes the data of the cases in the processing.
In order to continuously look back on the status of corporate and organizational operations, and to improve what needs to be improved, ensuring the achievement of goals, it is essential to combine KGI evaluation using BI tools and KPI evaluation using process mining tools.
Currently, more and more companies are using a combination of both tools, but as mentioned at the beginning of this article, the boundary between process mining tools and BI tools is blurring, and in the future, they will be provided as a combined tool.

