もちろん、DX成功の鍵はひとつだけではありません。しかし、他のあらゆるものが揃ったとしても、これなくしては、DXを着実に推進させ成功に導くことはできないと、確信を持って言えるものがあります。それは、DXを推進する常設の専任部署である「COE(Center of Excellence)」です。特に、DXの取り組みの肝となるビジネスモデル、ビジネスプロセスを変革するためには、BPM(Business Process Management)と呼ばれる、包括的な方法論が有効であることから、BPM-COEと呼ぶ専任チームの立ち上げが重要と考えます。
一方、BPM(Business Process Management)は、ビジネスプロセスを適切に運営するための方法論です。現状(as-is)のプロセスの改善だけでなく、新しいビジネスモデルに基づく、あるべき(to-be)プロセスの設計と展開、安定的運用と継続的な監視までをカバーする包括的なものです。
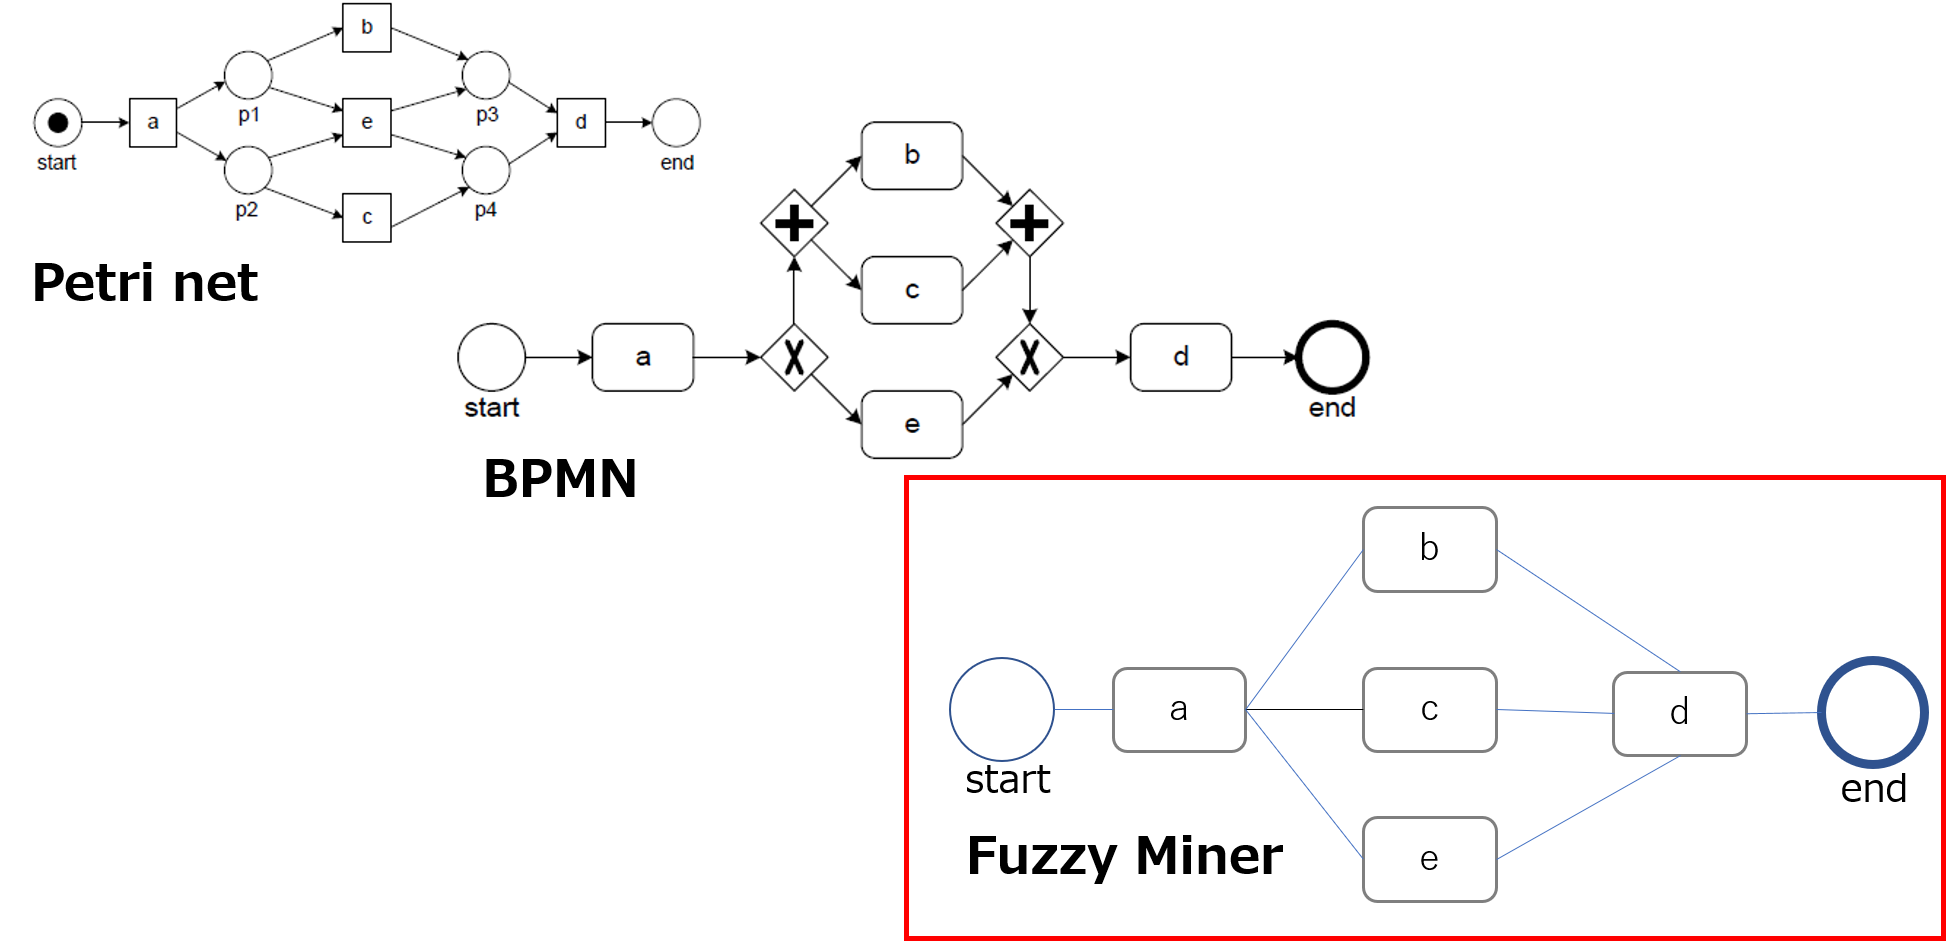
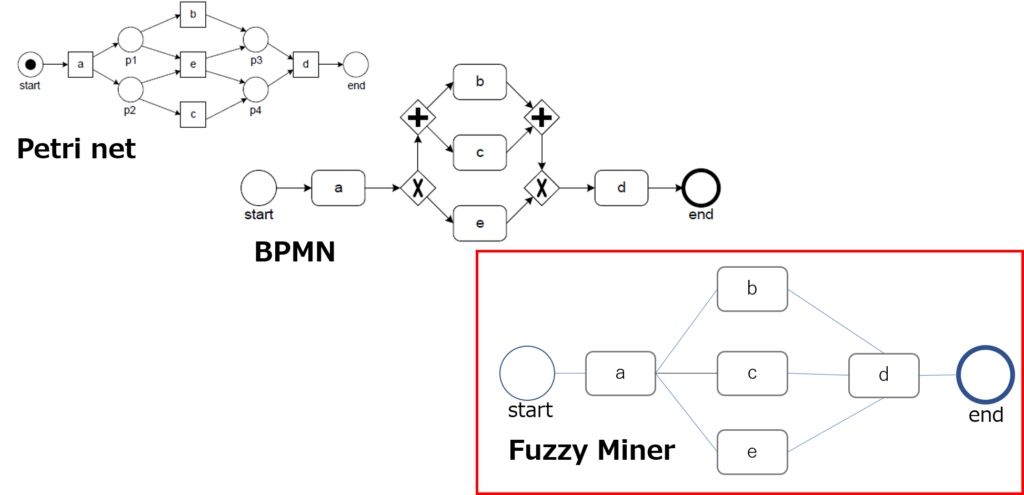
プロセスマイニングの基本機能である「プロセス発見」は、当初、ペトリネットがベースになっていたが、より現実に近いフローチャートを再現するために、様々なアルゴリズムが開発されてきている。ただ、業界有識者の話によれば、現在実用化されているプロセスマイニングツールのほとんどは、ファジーマイナーと呼ばれるアルゴリズムに基づいたもの(各社独自の改善は行っていると思われる)であると言われている。 同アルゴリズムは、一般にDFGs(Directly-follows Graphs)と呼ばれる。ペトリネットや、また業務手順をフローチャートとして記述するための世界標準であるBPMN(Business Process Modeling and Notation)と異なり、ノードとノードが直接(Directly)結びつけられたフローチャートがDFGsである。すなわち、分岐ノードが描かれないため、このアルゴリズムでは、どこでどのような分岐が発生しているのか、具体的には、排他的(OR)なのか、並行的(AND)なのか、といったことが把握できない。このため、現状のプロセスを自動的に再現するとはいっても、分岐が明確でない不完全なものになるというのが現実である。もちろん、これについては、BPMN形式のフローチャートへの自動変換や、前述したビジネスルールマイニングの採用などの機能改善が行われてきている。
図1 Petri net、BPMN、Fuzzy Minerのフロー図例 上図でわかるように、DFGsであるFuzzy Minerには、Petri netやBPMNのような分岐ノードが存在しないため、同じプロセスの表現でありながら、Fuzzy Minerでは分岐のルールを判別することができない。
このConvergence/Divergence問題は、プロセスマイニングの分析品質を左右する最大の課題と言える。そこで、近年では、プロセスマイニングのゴッドファーザー、Wil van der Aalst教授が率いる研究者たちが「Object-Centric Process Mining」(1)と称する独自の方法論により当課題の解決に取り組んでいる。 また、myInvenioには、マルチレベルマイニングという機能が実装されており、一つのプロセスについて複数の案件IDを設定することで、プロセスの集約・拡散の状況を加味したフローの再現を実現している。
Latest Process Mining Functionality, Challenges, and Future Evolutionary Trends
1 Latest Functions of Process Mining
Process mining tends to attract attention in terms of technology and tools, but its essence is a theoretical system and methodology (discipline) of data analysis. In fact, as the term “process” mining suggests, it can be considered as a type of data mining. However, unlike data mining, which is a broad concept that targets all kinds of events for analysis, process mining literally targets “processes” for analysis. The basic use of process mining is “process visualization,” and the visualization of processes facilitates the discovery of problems associated with the target processes. As a result, it can play a significant role in process improvement efforts.
1.1 Current Major Functions
As mentioned above, the research of process mining has started from the establishment of the methodology of “process visualization” and the development of tools. It is a function to automatically create a flowchart showing business procedures based on data extracted from IT systems used for business execution, and is called “Process Discovery. Since then, various functions have been implemented as research has progressed and tools have become more sophisticated. The following are the main analysis functions implemented in most of the current process mining tools.
Process Discovery
automatically create a flowchart of business procedures and calculate the frequency of work and time required.
Conformance Checking
compares and analyzes the current process (as-is) discovered based on data with the standard process (to-be), and extracts deviations from the current process.
Dashboards
A function to display the results of aggregation and analysis of target processes from various perspectives in various graphs and tables.
1.2 Latest Functions
In addition, in recent years, the most advanced process mining tools have begun to include the following latest functions.
Business Rule Mining
When there is a flow branching (decision node) in a target process, it automatically discovers the criteria (business rules) that determine the routing based on the data.
Simulation (What-If Analysis)
Simulate how much improvement can be expected by eliminating or automating some of the tasks in the current process visualized by the process discovery function.
Operational Support
For projects that are currently in progress, the system absorbs data related to business execution in real time, detects deviations in business operations, predicts future problems, and alerts the person in charge, suggests the best course of action, or automatically implements improvement measures.
Of the three latest functions mentioned above, business rule mining and simulation analyze past data, i.e., data that has already been completed, while operational support focuses on supporting smooth business execution by sequentially processing data related to unfinished projects. In this sense, it can be said that operational support is a form of IT solution that goes beyond the framework of analysis methodology. For this reason, Ceronis, the largest company in the process mining industry, calls this function “EMS (Execution Management System).
2 Issues to be overcome to make process mining better to be used
As seen in the acquisition of Signavio, a major tool vendor, by SAP and myInvenio by IBM, process mining is increasingly recognized as an important tool that is part of IT solutions. However, there are issues that need to be overcome in order for it to be used properly in business practices and to bring results. In this section, I would like to present the main issues from two perspectives.
2.1 Difficulties in data preprocessing
In data mining, it is said that about 80% of the total time required is spent on data preprocessing such as data collection, extraction, and cleaning. The same is true for process mining. It takes a lot of effort to properly integrate dozens to hundreds of data files extracted from various IT systems, to correct dirty data such as omissions and garbled characters, and to create a “data set” that can be fed into tools for analysis. Factors that make data pre-processing in process mining difficult include the fact that the source of data extraction is various business systems, and thus an understanding of the business systems is necessary. In addition, in order to create a data set to derive analysis results that contribute to business process improvement, it is necessary to understand the business itself and to have some familiarity with business improvement methods.
2.2 Analysis quality of tools
There are two issues that need to be addressed regarding the quality of analysis. One is the limitation of DFGs (Directly Follows Graphs), and the other is the Convergence/Divergence problem.
2.2.1 Limitations of DFGs
The basic function of process mining, “process discovery,” was initially based on Petri nets, but various algorithms have been developed to reproduce flowcharts closer to reality. However, according to industry experts, most of the process mining tools currently in practical use are said to be based on an algorithm called fuzzy miner (each company is believed to have made its own improvements).
This algorithm is commonly called DFGs (Directly-follows Graphs). Unlike Petri nets and BPMN (Business Process Modeling and Notation), which is the world standard for describing business procedures as flowcharts, DFGs are flowcharts in which nodes are directly connected to each other (directly). In other words, since branching nodes are not drawn, the algorithm cannot grasp where and how the branching is occurring, specifically, whether it is exclusive (OR) or concurrent (AND). For this reason, even if the current process is automatically reproduced, the reality is that the branching is not clear and incomplete. Of course, functional improvements have been made in this regard, such as automatic conversion to BPMN format flowcharts and the adoption of business rule mining as mentioned above.
2.2.2 Convergence/Divergence Problem
In process mining, three items, “case ID,” “activity (event),” and timestamp, are essential to draw a flowchart by bundling each activity performed for a case processed in the target process. For example, in the case of an invoice processing process, the individual invoice number attached to each invoice and the activities such as “receipt,” “confirmation,” “approval,” and “payment” for that invoice are extracted from the IT system along with the time stamp.
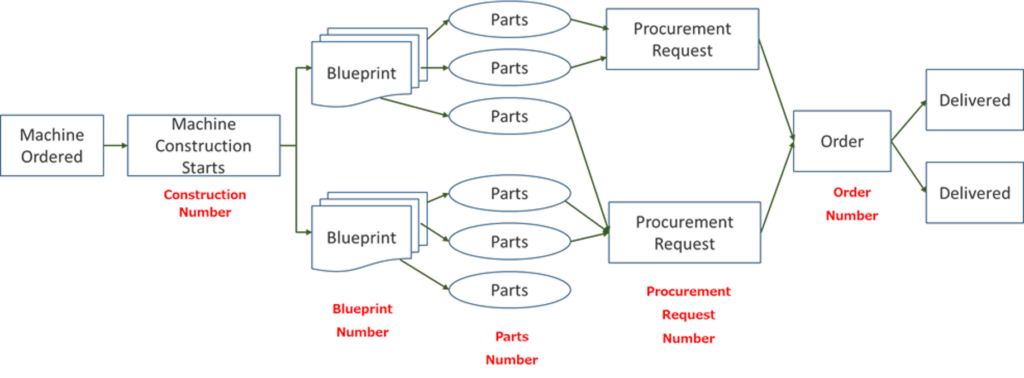
What we often face in the actual process is that there is no single case ID. Let’s take a concrete example. The figure below shows a general image of the process of an engineering company from order receipt to material procurement.
Since the ordered machine must be manufactured based on the specifications of the ordering company, after receiving the order, the company first designs the machine, then identifies the necessary materials and parts based on the blueprint, and then places an order with the supplier. Since multiple blueprints are created for a single machine, the Blueprint Number is used in the design stage. In addition, the Parts Number is used to identify materials and parts, and at the time of procurement, multiple parts are combined into several parts and a procurement request is issued. In this case, a Procurement Request Number is assigned. In addition, the multiple procurement requests are aggregated to each supplier and an order is placed. In this case, the Order Number becomes the ID for management.
In this way, the processes of convergence and divergence are commonly seen in practice as a single case is processed. In the conventional approach, the construction number at the beginning of the process is used as the case ID, and the entire process is analyzed up to the procurement of materials, but if there is convergence or divergence in the process, a process that is far from the actual situation is reproduced. (For example, the diffused part is recognized as a mere repetitive task.)
This Convergence/Divergence problem is the biggest issue that affects the analysis quality of process mining. In recent years, researchers led by Professor Wil van der Aalst, the Godfather of Process Mining, have been working on solving this problem using a unique methodology called “Object-Centric Process Mining” .
3 Future Direction of Evolution
We have already mentioned that process mining is playing a role as a business support solution beyond the framework of data analysis. In this section, we will discuss how process mining will evolve in the future from a bird’s eye view.
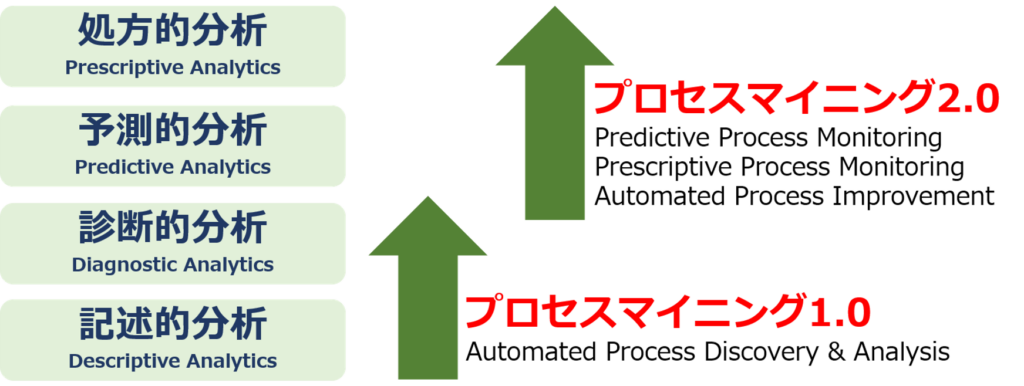
3.1 Process Mining 1.0
Process mining is. The basic function of process mining was “process discovery,” which automatically reproduces the current process from data. This is a “Descriptive Analysis” in that it depicts the current state as it is.
However, what we originally wanted to do was to extract problem areas such as inefficiencies and bottlenecks hidden in the process. In other words, we need to find out what is wrong with the process. Therefore, there is an additional function that can easily tell us where the problem is, such as the processing time of this part is too long or there are too many repetitions. This is a function that belongs to Diagnostic Analysis. In process mining tools, it is generally named “Root Cause Analysis.
The above is an analysis function for historical data, and should be called Process Mining 1.0.
3.2 Process Mining 2.0
When process mining starts to take in uncompleted, i.e., ongoing, case data in real time as a target of analysis, it becomes possible not only to detect deviations but also to predict how long it will take to complete the currently running case, and to predict deviations that may occur in the future. In addition, it is possible to predict how long it will take to complete a case that is currently running, and to predict future deviations. The number of tools that implement such predictive analysis is increasing.
Furthermore, based on the prediction results, tools that can suggest what actions should be taken now to shorten the time required or to prevent future deviations from occurring are also emerging. This is the function of “Prescriptive Analysis”.
Such process mining analysis that deals with incomplete data is a major upgrade of the existing process mining 1.0, and can be called process mining 2.0.
Although predictive and prescriptive analyses are still in their infancy and their reliability is not necessarily high, it is certain that they will be introduced to many companies as valuable solutions to support smooth business execution based on enterprise systems such as ERP through further technological progress in the future.
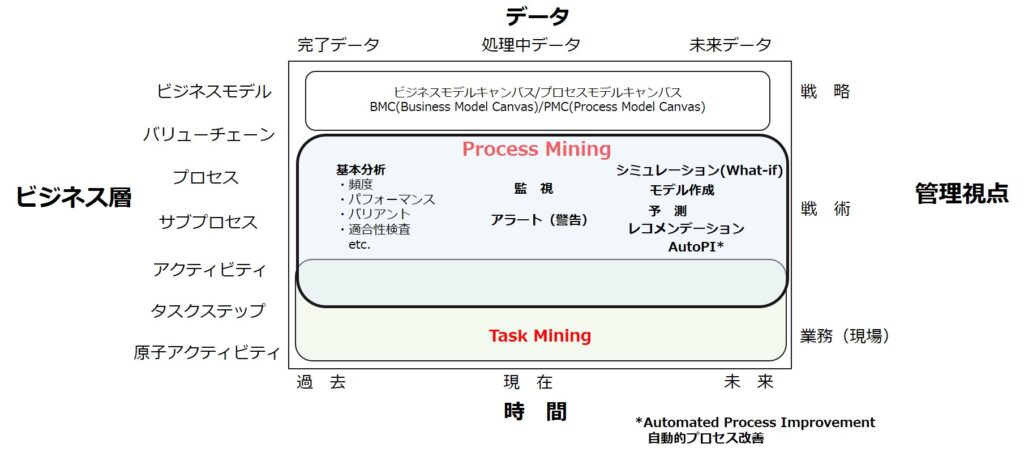
なお、マトリックスには記載しておりますが、プロセスマイニングの対象とはならない、ビジネスモデル層については、ビジネスモデルキャンバス(BMG:Business Model Canvas)、プロセスモデルキャンバス(PMG:Process Model Canvas)といったツールが活用できます。
Reference Matrix for Process Mining Tool Selection
In recent years, process mining has been further recognized and understood as a useful solution for promoting and establishing DX. In addition, as shown by the recent acquisition of myInvenio by IBM and Signavio by SAP, there is no doubt that process mining will become increasingly important as an indispensable component of corporate IT system development and operation as it is incorporated into the solutions of major IT companies.
Needless to say, the adoption of process mining tools is essential for companies to improve their business processes and to renovate and develop their systems using process mining, and the selection of the best suited tool for your company is a major key to success.
In this article, I will explain a matrix that will help you determine what functions of process mining tools are particularly necessary for your company.
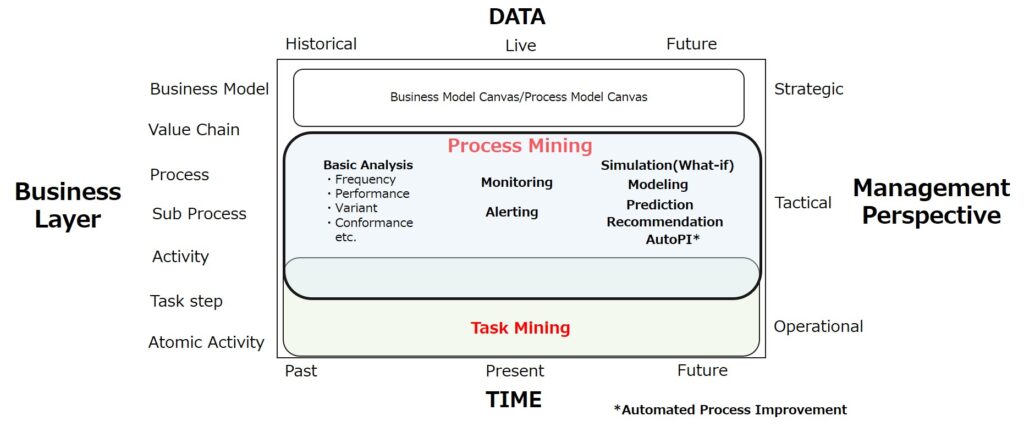
●Horizontal axis of the matrix: Time
From the perspective of time, there are three dimensions which are completed processes in the past, processes in progress at the moment, and future processes to be executed in the future.
In general, data analysis is done on completed historical data. The same is true for process mining analysis. By analyzing completed event log data with process mining tools, we can automatically model current processes and analyze them from various perspectives (basic analysis).
For example, the following basic analysis is available.
Frequency analysis
Performance analysis (analysis from the perspective of time required and cost)
Variant analysis
Conformance checking (comparative analysis of current process and ideal process)
etc.
There are some process mining tools which can do continuous monitoring and if problems such as deviations are detected, alerts are sent to the relevant parties by importing ongoing event log data to the process mining tool at a frequency close to real time.
For future processes that will take place in the future, the following functions will be supported.
Simulation (What-IF Analysis)
Simulate how much improvement (throughput reduction and cost reduction, etc.) can be obtained if the current process is improved in some way.
Modeling
Model the flow of the ideal process to be implemented in BPMN format.
Forecasting
predict how in-process projects will be processed in the future and how much time will be required by using AI.
Recommendations
Based on the results of the above predictions, the tool proposes the best measures to prevent problems from occurring and prolonging the processing time.
Automated Process Improvement (AutoPI)
A process mining tool automatically executes measures for process improvement under certain conditions to achieve a quick remedy.
●Vertical axis of the matrix: Business layer
The business layer is a factorization into more detailed components from a process perspective. Administratively, the higher the layer, the more “strategic” it is, and the lower the layer, the more “tactical” it is, and the more “operational” (day-to-day on-site management) it needs to be.
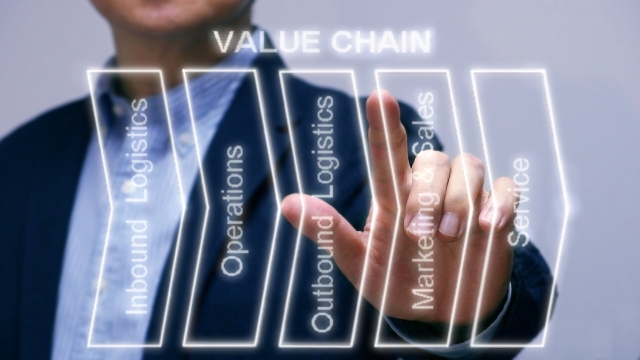
At the top is the business model. From there, the granularity becomes finer, including the value chain that grasps the processes of the entire company from end-to-end, and the individual processes that make up the value chain.
Any business process can be broken down into a number of sub-processes. One more sub-process is composed of finer-grained tasks, and those tasks are composed of multiple activities.
For example, if we consider a sub-process called “invoice processing” in the accounting department, this includes activities such as “receiving invoices,” “checking the contents of invoices,” “registering invoices in the accounting system,” and “processing payments for registered invoices.
Among these activities, in the case of “receive invoice,” each task step is executed one by one, such as “open the email with the PDF invoice attached” and “download the attached PDF invoice.
In addition, these task steps are executed in the smallest units of PC operations, such as clicking on the mail software icon, clicking on open mail, and clicking on the attachment. These are called “atomic activities” because they cannot be decomposed any further.
Process mining basically analyzes the activity layer (or task step layer, as the case may be) from the process layer. transactional data recorded in IT systems are often at the activity level, which is relatively coarse-grained. In many cases, transaction data recorded in IT systems is at a relatively coarse activity level.
Therefore, task mining is used to analyze task steps and atomic activities with finer granularity. Task mining is still in its infancy, and it is still at the stage of trial and error for deeper analysis besides BI-like aggregation. However, by using it together with process mining, it can contribute to process automation, especially with RPA.
Now, in light of your company’s business process issues, which should be the target of analysis: past, present, or future? Also, at what granularity should the process be analyzed as a business layer?
With the person in charge of the tool vendor, let’s look at this matrix together to understand the extent to which these functions can be implemented while recognizing where the company is aware of the issues.
For the business model layer, which is not subject to process mining, tools such as Business Model Canvas (BMG) and Process Model Canvas (PMG) can be used.
Will Process Mining tool and BI tool be amalgamated?
The answer is yes. The integration has already begun.
In terms of specific developments, a process mining tool called “PAFnow” is available as an add-on for Power BI. Similarly, “MEHRWERK ProcessMining” is offered as an add-on for Qlik.
On the other hand, process mining tools have also been enriching their “dashboard features” in addition to the standard features of process mining, such as “process discovery” which automatically creates a process model from the event log, but this dashboard feature is now close to the level of functionality provided by BI tools.
By the way, both process mining tools and BI tools are the same in that they take in various data related to corporate and organizational management, calculate numbers from various angles, and present the results visually in tables and graphs.
The decisive difference between a process mining tool and a BI tool is in how the calculation results are interpreted and utilized.
Concretely, we can explain as follows.
Calculation results presented by process mining tools
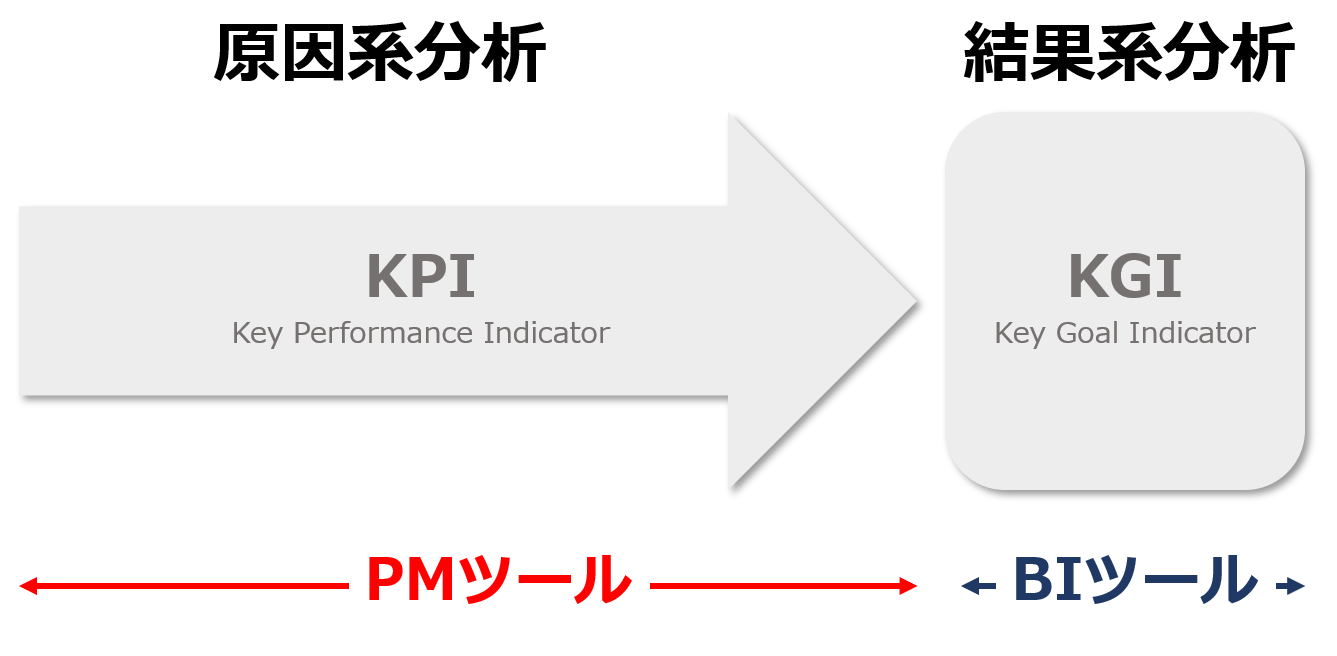
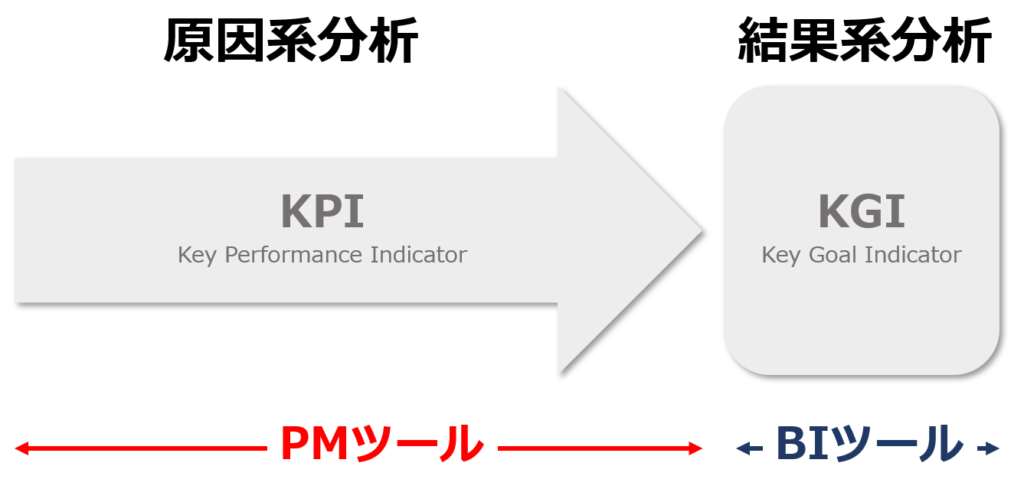
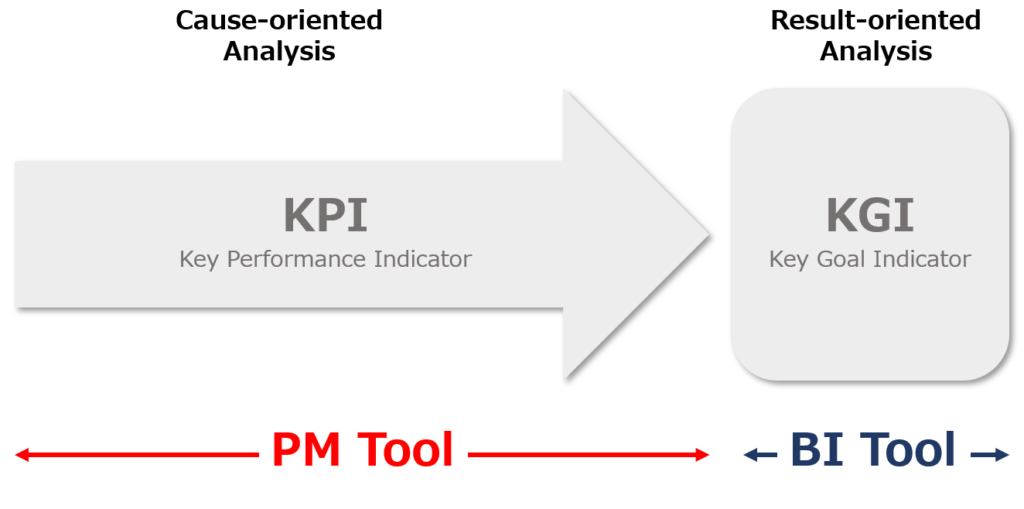
Process mining tools mainly look to performance of activities (processes) that create value = causals. In other words, process mining tools mainly cover Key Performance Indicators (KPIs).
For example, in the case of an insurance company’s claims processing process (from insurance claim to payment), process mining tools can analyze the number of cases for each activity in the process, the total time required for processing (throughput), processing cost, and the number of people in charge, and so on. In addition, the process discovery function can automatically draw a flowchart of business procedures to identify problems such as bottlenecks and inefficient repetitive tasks.
In this way, by analyzing activities that create value, i.e., causal data analysis, it is possible to link them to business process improvement measures to further increase value or reduce costs.
Calculation results presented by BI tools
BI tools mainly look at The size of value (sales, profit, etc.) generated = outcomes. In other words, BI tools cover KGI (Key Goal Indicator).
BI tool basically calculates sales, profit, market share, etc. as a result of corporate activities, and enables multifaceted analysis in various dimensions such as by division, area, and product.
BI tools can make judgments about which business units or areas are producing superior (or inferior) results, but they cannot infer the causes of why results are superior (or inferior). This is because it does not analyze causal data in the first place.
As explained above, to summarize the differences between them, BI tools are like a report book at the end of the term, and they are used to make final evaluations and to set new goals for theKGI in the next term. On the other hand, process mining tools are used to analyze performance in detail during the period and consider how to improve it in order to achieve the goals of KGI.
There is one more difference in the way data is analyzed that has recently emerged.
While BI tools only calculate a snapshot figure of historical data for the entire analysis period, process mining tools are now adding the ability to perform real-time monitoring that sequentially analyzes the data of the cases in the processing.
In order to continuously look back on the status of corporate and organizational operations, and to improve what needs to be improved, ensuring the achievement of goals, it is essential to combine KGI evaluation using BI tools and KPI evaluation using process mining tools.
Currently, more and more companies are using a combination of both tools, but as mentioned at the beginning of this article, the boundary between process mining tools and BI tools is blurring, and in the future, they will be provided as a combined tool.
Introduction to Process Mining (16)Process Mining Tools
今回は、「プロセスマイニングツール」について詳しく解説します。
プロセスマイニングツール - グローバル
現在、世界にはどんなプロセスマイニングツールがあるのか概観してみましょう。
2019年の時点で、大小合わせて30以上のプロセスマイニングツールが世界には存在していると言われています。 米ITアドバイザリ企業Gartnerが2019年6月に発表した、『Gartner, Market Guide for Process Mining, Marc Kerremans, 17 Jun 2019』においては、代表的なベンダー・ツールが19種類挙げられています。
Apromore – Apromore
Celonis – Celonis Process Mining
Cognitive Technology – myInvenio
Everflow – Everflow
Fluxicon – Disco
INTEGRIS Explora
Lana Labs – LANA Process Mining – Magellanic
Logpickr – Logpickr Process Explorer 360
Mehrwerk AG – MEHERWERK ProcessMining (MPM)
Minit – Minit
Process Anaytics Factory – PAFnow
Process Mining Groups at TUE and RWTH – ProM, ProM Lite, RapidProm M, PM4Py
Process Gold – ProcessGold *現在はUiPath Process Mining
Puzzle Data – ProDiscovery
QPR Software – QPR ProcesAnalyzer
Signavio – Signavio Process Intelligence
Software AG – ARIS Process Mining
StereoLOGIC – StereoLogic Process Analysis
TimelinePI – Process Intelligence Platform *現在はABBYY Timeline
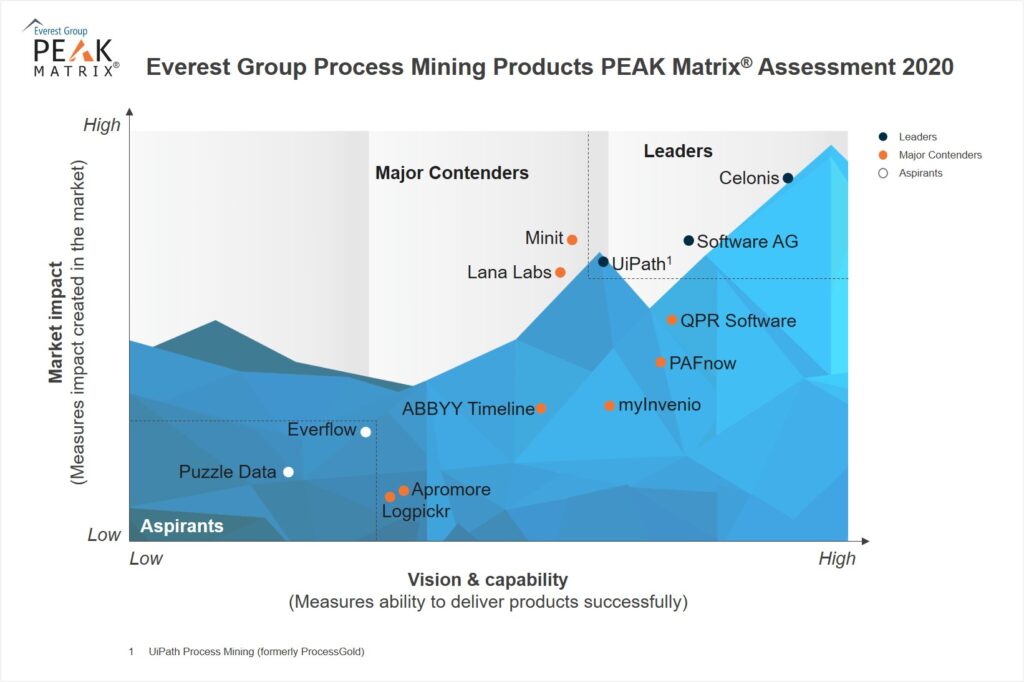
プロセスマイニングはまだ新しい市場であるため、ベンダー各社のライセンス販売本数や売上もほとんどが非公開、調査会社による市場シェア等は当てになりません。とはいえ、Celonisが市場リーダーであることは間違いなく、2番手にCognitive Technology、さらにABBYY Timeline、Uipath Process Mining、 Minit、Signavioなどが続いている状況だと推測しています。
市場リーダーのCelonisは既に社員数900人を抱え、大型の資金調達にも成功して「ユニコーン」としても認められる存在。そして、リーダーグループの一角を占めるSoftware AGは、「ARIS」のブランドで知られ、「ARIS Process Mining」の販売にも力を入れてきています。Uipath社は、買収したProcessGoldを「UiPath Process Mining」に名称を変え、UiPathが強みを持つRPAを含むトータルソリューションとして提案力を強化しています。
process mining technology vendor landscape with products PEAK Matrix(R) Assessment 2020 Everest Group
Organizing the functionality of a process mining tool based on the purpose of analysis
Process mining tools that perform analysis based on event logs are basically very versatile and are evolving with new features being added every day. It’s not easy to get an overview of the features of a process mining tool when you’ve just been given a one-size-fits-all explanation or demo.
So, in this article, let’s start with what kind of analysis you want to do, that is, the “purpose of the analysis”, and organize what kind of function it has.
Please note that we have deliberately left out task mining because it is a technologically immature feature and we are focusing on the main features.
Now, there are many ways to analyze using process mining tools, but I would like to divide them into the following four main categories.
1 Process Focus
This is the basic analytical perspective of process mining. The analysis focuses on the flow of the target process.
2 Organizational Focus
The three required data items for process mining analysis are process ID, activity, and time stamp. In addition to these three items, “resource (user in charge)” and “role (department and position)” are typically analyzed as semi-requisite items.
In addition to the process itself, the Organizational Focus analyzes the process from the perspective of the people in charge of executing the process and their departments and positions.
This approach is sometimes referred to as “organizational mining”.
3 Simulation Focus
Literally, it’s an approach to simulating by setting up some parameters.
4 Operational Focus
Process mining analysis is essentially an approach that targets previously completed data, but analyzes currently running and uncompleted processes in real time.
Let’s take a look at the analysis objectives and corresponding functions for each cut.
1 Process Focus
1.1 I want to know what the variations of the process are.
⇒ Variant Analysis
1.2 I’d like to see the number of cases flowing through the process.
⇒ Frequency analysis function
1.3 I want to see the time required for a process (throughput, lead time between activities, etc.)
⇒ Performance analysis function
1.4 I want to Discover deviant processes compared to standard processes (to be processes)
⇒ Conformity inspection function
1.5 I want to compare multiple process variations.
⇒ Comparative analysis function
1.6 I would like to delve deeper into the causes of the problem regarding inefficiencies and bottlenecks in the process.
⇒ Root cause analysis function
1.7 I want to understand the deviation from the KPI target values (throughput, processing time, etc.).
⇒ KPI setting function
1.8 I want to understand the business rules in the process branch (gateway).
⇒ Business Rule Mining Function
1.9 I want to create a BPMN-compliant model.
⇒ BPMN model conversion function
⇒ BPMN model creation and editing functions
2 Organizational Focus
2.1 I want to know which person is in charge of which activity.
⇒ Activity Map Function
2.2 I want to calculate the number of processes and processing time for each person in charge.
⇒ Create customized dashboards
2.3 I would like to understand how those in charge of the process relate to each other in the target process.
⇒ Social network function
3. Simulation Focus
3.1 We want to verify the effects of changing a part of the process or implementing RPA.
⇒ Simulation function
4 Operational Focus
4.1 I want to estimate how much more time it will take to complete an incomplete process.
⇒ Predictive analysis function
4.2 I’d like to estimate the steps to be taken to shorten the throughput of an incomplete process.
⇒ Recommended process functions
4.3 I want to send an alert to a person in charge when a deviation process occurs.
⇒ Alert function
Above, we have organized the features of the process mining tool according to the purpose of the analysis. Please note that the function names of each tool are different.
When selecting a tool, understand how you want to analyze the process to be analyzed from the perspective of your company, and then confirm whether the candidate tool has any functions.
市場リーダーのCelonisは既に社員数800人を抱え、大型の資金調達にも成功して「ユニコーン」としても認められる存在。そして、リーダーグループの一角を占めるSoftware AGは、「ARIS」のブランドで知られ、「ARIS Process Mining」の販売にも力を入れてきています。また、先ごろ買収したProcessGoldを「UiPath Process Mining」と名称を変え、UiPathが強みを持つRPAを含んだトータルソリューションとして提案力を強化しています。
Major Contender、すなわちリーダーグループに闘いを挑んでいる主要な競争ベンダーはまさに群雄割拠という状況。なお、私が把握している限りですが、日本においてなんらか連絡先があるのは、ABBYY Timeline、LANA Lab、myInvenioの3つだけです。
“Process mining” was born in the late 1990s and last year turned 20 years old. In 2019, a new concept called “task mining” appeared.
In this article, I would like to organize and sort out the differences in purpose and positioning, including “SIEM: Security Information and Event Management”, which is a similar solution to process mining and task mining.
First, the difference between process
mining and task mining. In simple terms, the data to be analyzed is different.
Process mining analyzes the event logs
(transaction data) recorded and accumulated in business systems such as ERP,
CRM, and SFA. The recorded data is based on activities such as “purchase
request” and “purchase approval” when the “send” or
“update” button of the system is pressed, and the granularity of only
the “milestone” of the business Is a rough thing.
On the other hand, task mining analyzes the
detailed operations on PCs that employees operate individually, specifically,
the “PC operation log” that records application launches, file opens, mouse
clicks, copy and paste, etc. Eligible. Compared to the event log extracted from
the business system, it is “atomic” detailed data that cannot be
further decomposed and can be analyzed at the task level. Since these PC
operation logs are not recorded anywhere, install software called sensors or
agents on the PC to be analyzed and actively capture and collect PC operations
as data. A mechanism to accumulate on the server is required.
“SIEM” is a similar solution
adjacent to process mining and task mining. It analyzes security logs, network
devices, and various logs remaining on servers to find security-related issues
such as cyber attacks and data leaks, and manages IT devices as assets. And so
on.
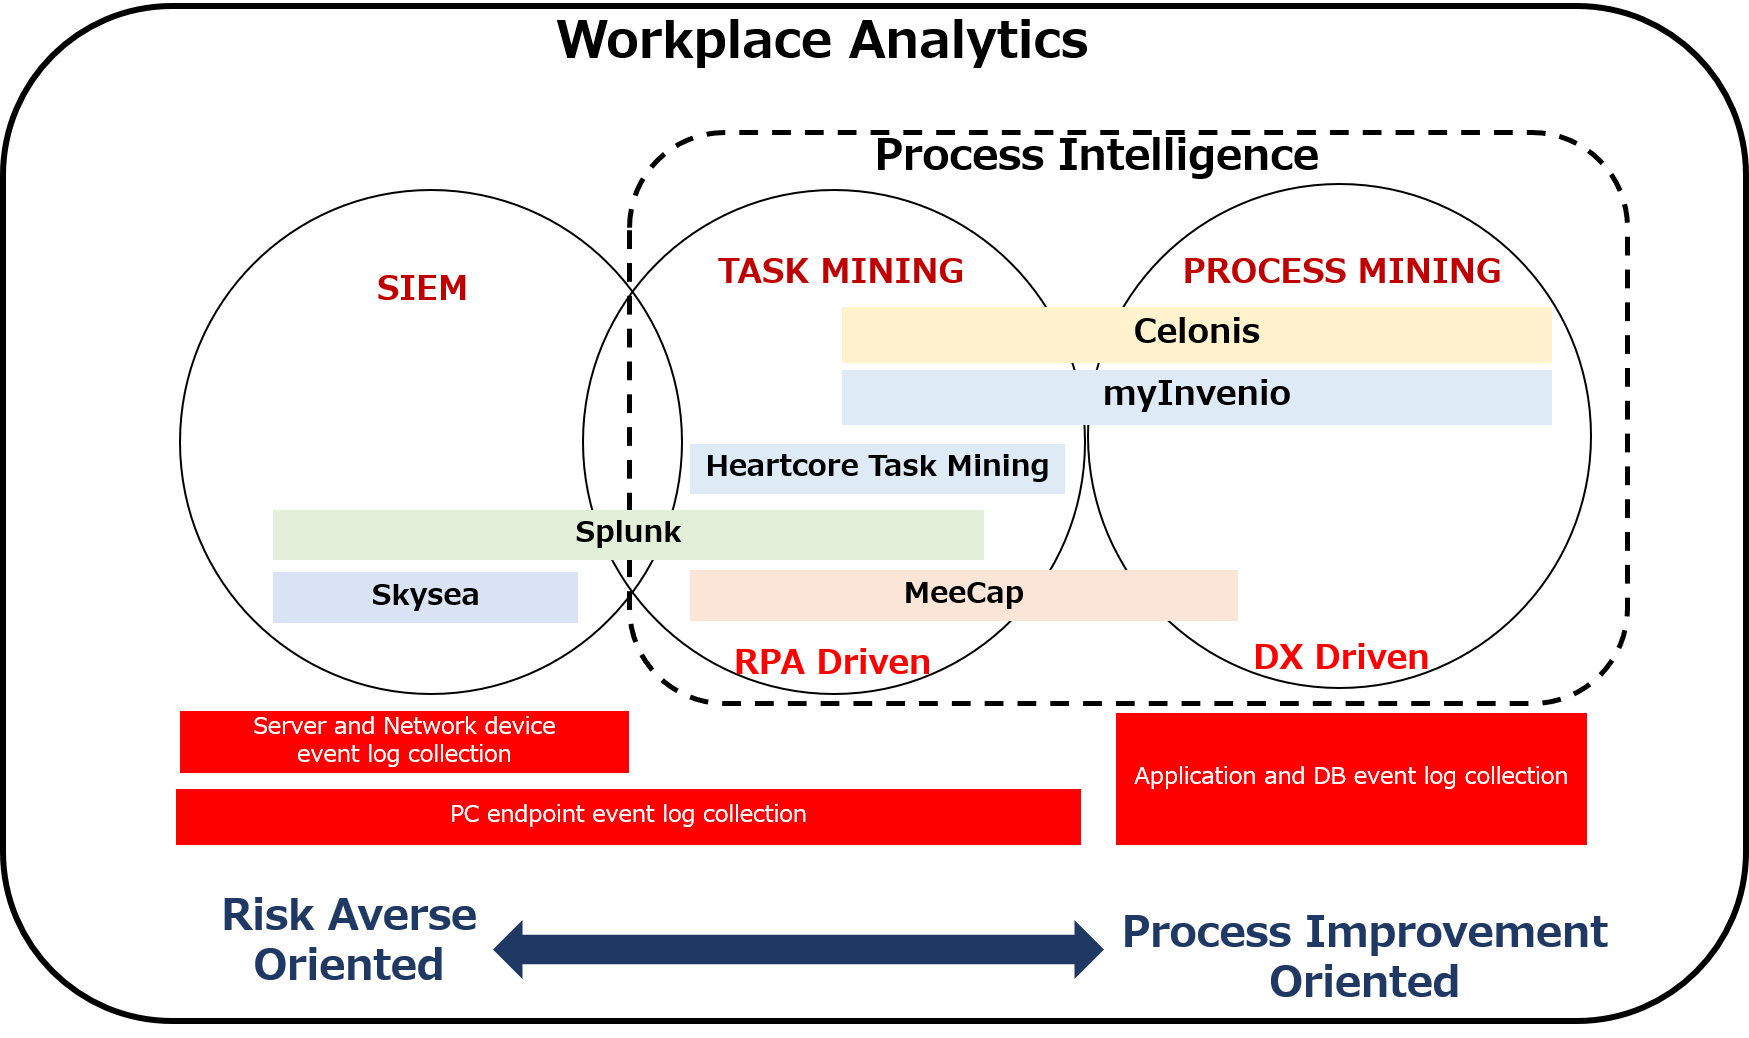
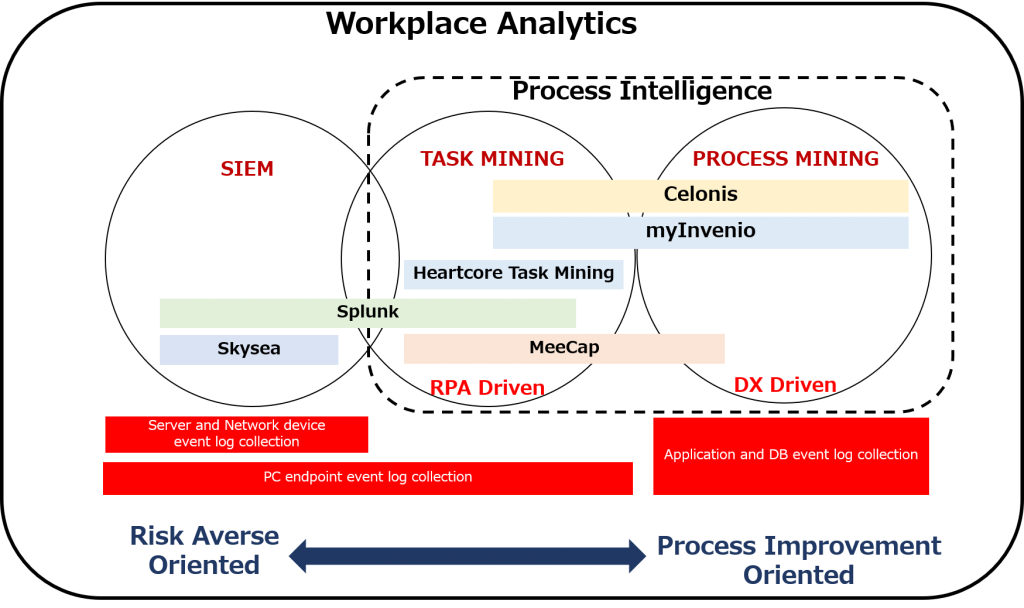
Now, since these solutions basically
analyze data generated in the “workplace”, they can be broadly put into the
framework of “Workplace Analytics”.
Now let’s position process mining, task
mining, SIEM, and their key solutions within the framework of workplace
analytics. (See the figure below)
Look around the double arrow at the bottom
of the figure. Process mining is “process improvement oriented”,
while “SIEM” is “risk aversion and management oriented”.
Task mining is located in the middle. This is because task mining can be used
for attendance management because it allows you to understand the entire daily
work of employees. (In process mining, since only the data of operations performed
on the business system is the analysis target, it is not possible to grasp the
entire business of the day.)
In addition, process mining and task mining
can be surrounded by the framework of “process intelligence”, but SIEM is not
included because “process” is not analyzed.
And process mining is “DX-driven” because it is effective for process reform of the entire company and approach from the viewpoint of digital transformation (DX), while task mining is ultimately an automation at the task level Because it is often aimed at a certain RPA, it can be said that it is “RPA-driven”.
Let’s look at the key solutions in each
category. At this time (February 2020), two key players in the Japanese process
mining market are Celonois and myInvenio. Both tools are enterprise solutions
with rich functions and excellent operability, and the number of enterprises,
especially large enterprises, is increasing. And recently, both tools have
added a “task mining function”. By being able to create not only
event log data from business systems, but also flow charts (process models)
from PC operation logs, it can be said that it meets the analysis needs
necessary for RPA to aim for task-level automation Will be.
In the task mining category, heartcore,
myInvenio’s sole agent in Japan, provides Heartcore Task Mining. In addition,
MeeCap, which has a track record of introduction in the banking industry, has
begun to expand to a process mining function that analyzes event logs from ERP
and other sources.
In the SIEM category, Splunk and Skysea View are known, but Splunk has added a process flowchart function. However, it seems that analysis cannot be performed until the event log is imported.
2019年の時点で、大小合わせて30以上のプロセスマイニングツールが世界には存在していると考えられます。 米ITアドバイザリ企業Gartnerが2019年6月に発表した、『Gartner, Market Guide for Process Mining, Marc Kerremans, 17 Jun 2019』においては、代表的なベンダー・ツールが19種類挙げられています。
Apromore – Apromore
Celonis – Celonis Process Mining
Cognitive Technology – myInvenio
Everflow – Everflow
Fluxicon – Disco
INTEGRIS Explora
Lana Labs – LANA Process Mining – Magellanic
Logpickr – Logpickr Process Explorer 360
Mehrwerk AG – MEHERWERK ProcessMining (MPM)
Minit – Minit
Process Anaytics Factory – PAFnow
Process Mining Groups at TUE and RWTH – ProM, ProM Lite, RapidProm M, PM4Py
Process Gold – ProcessGold
Puzzle Data – ProDiscovery
QPR Software – QPR ProcesAnalyzer
Signavio – Signavio Process Intelligence
Software AG – ARIS Process Mining
StereoLOGIC – StereoLogic Process Analysis
TimelinePI – Process Intelligence Platform *2019年にABBYY社が買収