プロセスマイニングツールとBIツールは融合するか?

difference between pm tool and bi tool

Will Process Mining tool and BI tool be amalgamated?
English follows Japanese. Before proofread.

プロセスマイニングツールとBIツールは融合するか?

その答えはイエスです。すでに融合が始まっています。

具体的な動きとしては、Power BIのアドオンとして「PAFnow」というプロセスマイニングツールが提供されています。同様に、Qlikのアドオンとしては「MEHRWERK ProcessMining」が提供されています。

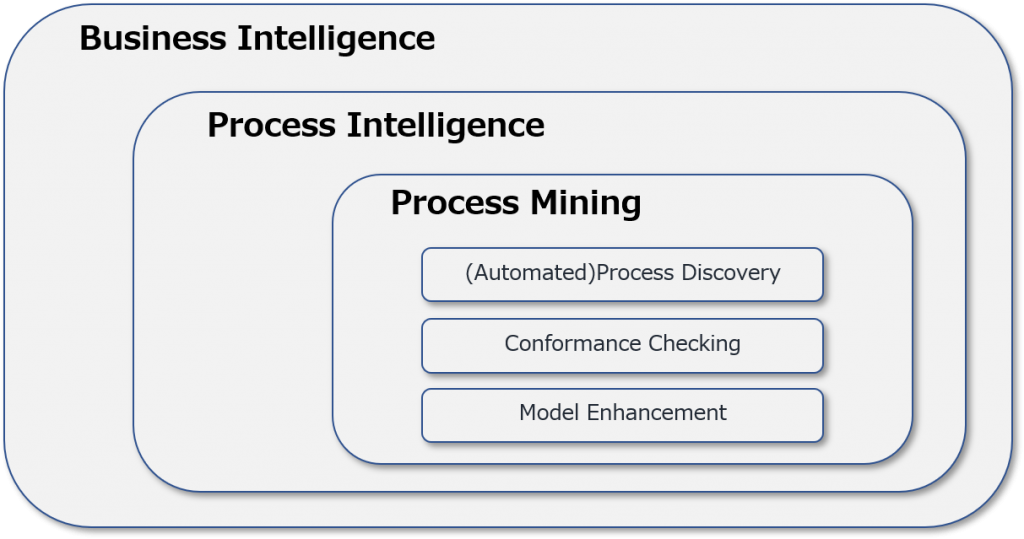
一方、プロセスマイニングツールも、イベントログからプロセスモデルを自動的に作成する「プロセス発見」をはじめとするプロセスマイニングの標準機能に加えて、「ダッシュボード機能」を充実させてきていますが、このダッシュボード機能はBIツールが提供する機能水準に近付きつつあります。


さて、プロセスマイニングツール、BIツールのどちらも、企業・組織運営に関わる様々なデータを取り込んで、様々な切り口で数値を演算し、その結果を表やグラフなどでビジュアルに提示するという点は同じです。

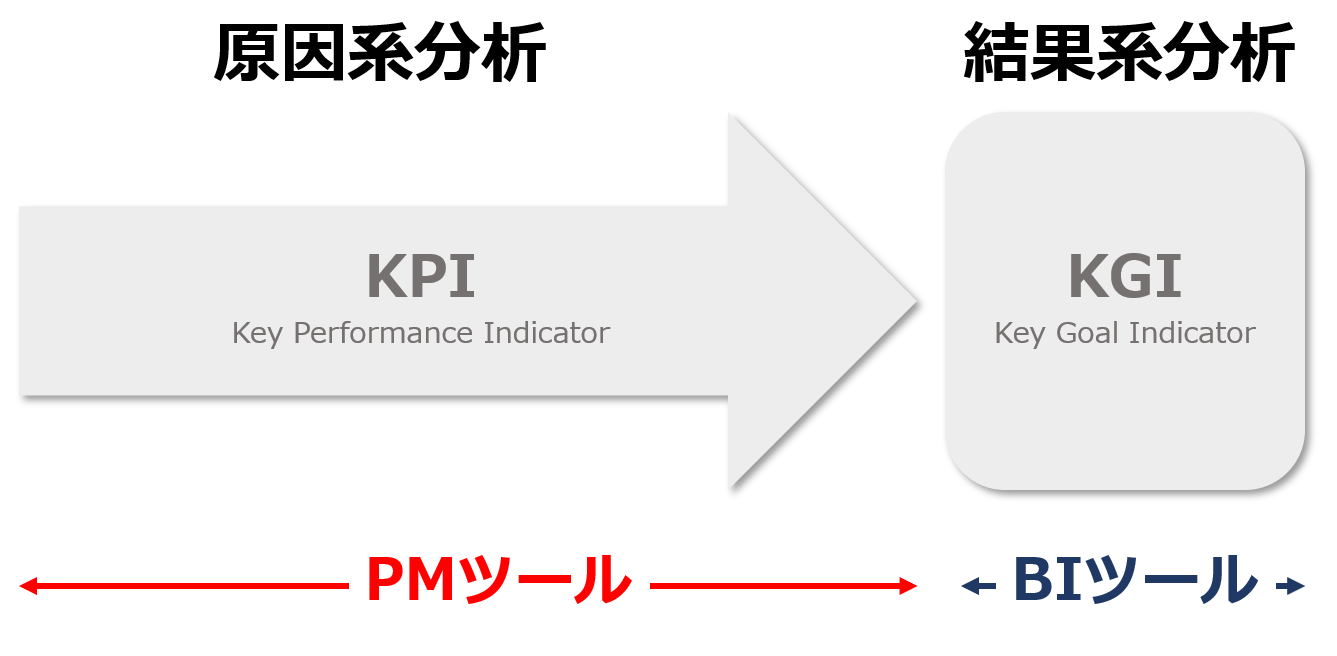
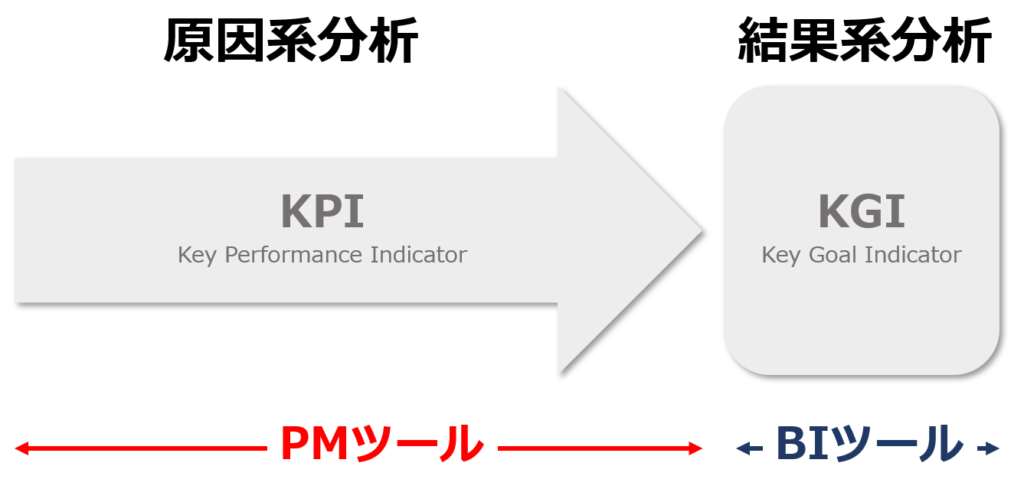
プロセスマイニングツールとBIツールの決定的な違いは、演算結果をどのように解釈し、活用できるか、という点にあります。

具体的には、以下のように説明できます。


●プロセスマイニングツールが提示する演算結果

価値を生み出すアクティビティ(プロセス)のパフォーマンス=原因指標である。すなわち、プロセスマイニングツールがカバーするのは主に、KPI(Key Performance Indicator)である。

たとえば、保険会社の保険金請求処理プロセス(保険加入者からの保険金請求~保険金支払い)であれば、プロセスマイニングツールで分析することによって、プロセスに含まれるアクティビティごとの処理案件数や、処理に要した総所要時間(スループット)、処理コスト、担当者数などを算出できる。

また、プロセスマイニングならではのプロセス発見機能によって、業務手順を自動的にフローチャートとして描き出し、プロセスのどの部分にボトルネックや非効率な繰り返し作業が発生しているかを特定できる。

このように、価値を生み出すアクティビティ、すなわち原因系データを分析することで、さらに価値を高めたり、あるいはコストを削減するための業務プロセス改善施策へとつなげることができる。

BIツールが提示する演算結果

生み出された価値(売上や利益など)の大きさ=結果指標である。すなわち、BIツールがカバーするのは、KGI(Key Goal Indicator)である。

BIツールでは、企業活動の結果としての売上や利益、市場シェアなどを主に算出し、事業部別、エリア別、製品別などの各種次元(ディメンジョン)で多面的な分析が可能である。

BIツールでは、どの事業部、あるいはエリアが優れた(劣った)結果を残しているか、という判断を行うことはできるが、なぜ結果が優れているか(劣っているか)という原因を推測することはできない。そもそも、結果につながる原因系データを分析対象とはしていないためである。


以上ご説明したように、両者の違いをまとめると、BIツールは、期末の通信簿のようなものであり、最終的な評価を下し、また次期のKGIの目標設定に役立てるもの。一方、プロセスマイニングツールは、期中の細かいパフォーマンスを分析して、KGIの目標達成のためにどのように改善すべきかを検討するために役立てるもの、と言えるでしょう。

なお、データの分析方法について、最近新たに生じてきたもうひとつの違いがあります。

BIツールは分析期間全体を対象とした過去データのスナップショットの数値を算出するのみであるのに対し、プロセスマイニングツールは、現在は知っている案件のデータを逐次分析するリアルタイムモニタリングを行う機能が付加されてきているということです。


企業・組織運営の状況を継続的に振り返り、改善すべき点は改善し、目標達成を確実にするためには、BIツールによるKGI評価とプロセスマイニングツールによるKPI評価の両方を併せて行うことが不可欠です。

現状は、両者のツールを組み合わせて活用する企業が増えていますが、冒頭に述べたように、プロセスマイニングツールとBIツールの境界はぼやけつつあり、将来的には融合して一体的なツールとして提供されていくことになると思われます。


Will Process Mining tool and BI tool be amalgamated?

The answer is yes. The integration has already begun.

In terms of specific developments, a process mining tool called “PAFnow” is available as an add-on for Power BI. Similarly, “MEHRWERK ProcessMining” is offered as an add-on for Qlik.

On the other hand, process mining tools have also been enriching their “dashboard features” in addition to the standard features of process mining, such as “process discovery” which automatically creates a process model from the event log, but this dashboard feature is now close to the level of functionality provided by BI tools.

By the way, both process mining tools and BI tools are the same in that they take in various data related to corporate and organizational management, calculate numbers from various angles, and present the results visually in tables and graphs.

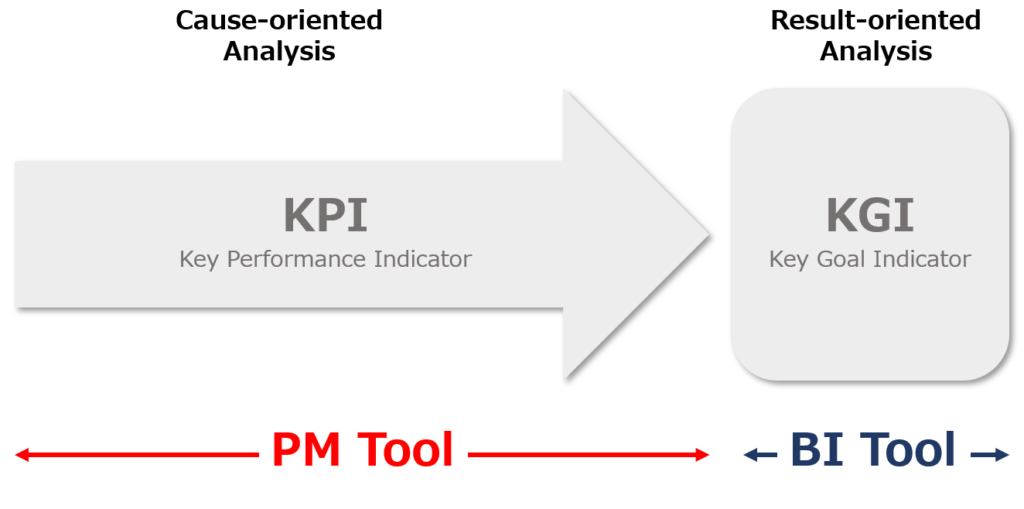
The decisive difference between a process mining tool and a BI tool is in how the calculation results are interpreted and utilized.

Concretely, we can explain as follows.

Calculation results presented by process mining tools

Process mining tools mainly look to performance of activities (processes) that create value = causals. In other words, process mining tools mainly cover Key Performance Indicators (KPIs).

For example, in the case of an insurance company’s claims processing process (from insurance claim to payment), process mining tools can analyze the number of cases for each activity in the process, the total time required for processing (throughput), processing cost, and the number of people in charge, and so on. In addition, the process discovery function can automatically draw a flowchart of business procedures to identify problems such as bottlenecks and inefficient repetitive tasks.

In this way, by analyzing activities that create value, i.e., causal data analysis, it is possible to link them to business process improvement measures to further increase value or reduce costs.

Calculation results presented by BI tools

BI tools mainly look at The size of value (sales, profit, etc.) generated = outcomes. In other words, BI tools cover KGI (Key Goal Indicator).

BI tool basically calculates sales, profit, market share, etc. as a result of corporate activities, and enables multifaceted analysis in various dimensions such as by division, area, and product.

BI tools can make judgments about which business units or areas are producing superior (or inferior) results, but they cannot infer the causes of why results are superior (or inferior). This is because it does not analyze causal data in the first place.


As explained above, to summarize the differences between them, BI tools are like a report book at the end of the term, and they are used to make final evaluations and to set new goals for theKGI in the next term. On the other hand, process mining tools are used to analyze performance in detail during the period and consider how to improve it in order to achieve the goals of KGI.

There is one more difference in the way data is analyzed that has recently emerged.

While BI tools only calculate a snapshot figure of historical data for the entire analysis period, process mining tools are now adding the ability to perform real-time monitoring that sequentially analyzes the data of the cases in the processing.

In order to continuously look back on the status of corporate and organizational operations, and to improve what needs to be improved, ensuring the achievement of goals, it is essential to combine KGI evaluation using BI tools and KPI evaluation using process mining tools.

Currently, more and more companies are using a combination of both tools, but as mentioned at the beginning of this article, the boundary between process mining tools and BI tools is blurring, and in the future, they will be provided as a combined tool.

プロセスマイニングvsプロセスインテリジェンス

business intelligence process intelligence process mining

Process Mining vs Process Intelligence
English follows Japanese. Before proofread.

プロセスマイニングについて書かれた資料やベンダー情報では、「プロセスインテリジェンス」という言葉がしばしば登場します。

「プロセスインテリジェンス」がどのようなものか、ベンダーによってその定義は異なるようですが、明確な説明がないため、プロセスマイニングとどう違うのか混乱されている方も多いと思われます。

当記事では、「プロセスマイニング」と「プロセスインテリジェンス」の関係性や違いについて、「ビジネスインテリジェンス」も含め、わかりやすさを優先して解説したいと思います。

実のところ、両者の関係性は明白で、2011年に発行された「プロセスマイニングマニフェスト」に以下の図が掲載されています。

ご覧の通り、一番大きな枠として「ビジネスインテリジェンス」があり、その内側に「プロセスインテリジェンス」、さらにその内側に「プロセスマイニング」があるという入れ子構造になっています。

まずビジネスインテリジェンスですが、文字通り、ビジネスに関わるあらゆるデータ・情報を分析対象として収集し、分析するものです。いわゆるBIツールを用いて分析することが多いですが、典型的には、売上や利益などの財務データをベースに、年度別、月別、週別などの推移を見たり、エリア別や製品別にドリルダウンして、売上や利益に貢献しているエリアや製品カテゴリ、逆に足を引っ張っている要因がどこかを掘り下げて分析する。これがビジネスインテリジェンスです。

ビジネスインテリジェンスのうち、特に業務プロセスに関わるデータ・情報に絞って各種分析を行うのが「プロセスインテリジェンス」です。さらに、プロセスインテリジェンスの中で、業務の流れ、すなわち「コントロールフロー」を核とする分析手法が「プロセスマイニング」です。

このようにみると、プロセスマイニングは大きくはビジネスインテリジェンスに含まれるため、ビジネスインテリジェンスで代替できるのではないか、とおっしゃる方もいます。

しかし、プロセスマイニングの基本機能である「(自動的な)プロセス発見」には、特殊なアルゴリズムが必要であり、BIツールには、このアルゴリズムは通常、実装されていません。また、BI機能に基づいて、プロセスマイニング用のアルゴリズムをゼロベースで組むのは現実的には不可能です。(初歩的なものは組めたとしても、それによって、再現されたプロセスモデルの信頼性は低いものでしょう)

したがって、プロセスマイニングを実行したければ、専用のプロセスマイニングツールの採用が必要になり、BIで代替することはできません。

では、プロセスインテリジェンスがカバーする領域はどこになるのでしょうか?

プロセスマイニングツールでは、特殊なアルゴリズムを用いて行うプロセス発見以外に、様々な統計数値を算出し、様々な表・グラフで表現する機能が備わっています。

例えば、分析対象としたプロセスに含まれる案件数、プロセスの開始から終了までのスループット(サイクルタイム)や、各アクティビティごとの処理数、処理時間、あるアクティビティから別のアクティビティまでの移行時間、すなわち待ち時間などです。そして、これらの数値に関して平均、最大・最小、中央値、標準偏差などを併せて確認することが可能です。

こうした統計数値の算出は、シンプルな四則演算ベースで可能であり、特殊なアルゴリズムは言うまでもなく必要ありません。BIでも簡単に実行できますが、これこそ「プロセスインテリジェンス」がカバーしている領域です。

プロセスマイニングによる分析においては、アルゴリズムを通じて発見された「プロセスモデル」(as isプロセスモデル)を起点に、様々なバリエーションを検証する「バリアント分析」や、理想プロセス(to beプロセス)との比較分析、すなわち適合性検査などを行います。

さらに、処理時間がKPIを超えている問題アクティビティや、待ち時間が長くなっているボトルネックを特定していきますが、ここで重要になってくるのが処理件数や処理時間、待ち時間などの基本統計数値です。

すなわち、プロセスマイニングでは、プロセスモデルと併せてプロセスインテリジェンスの数値を様々な視点で掘り下げることを行うわけです。

主要なプロセスマイニングツールでは、プロセスモデルを作成するアルゴリズムは当然として、プロセスインテリジェンス機能、特に、様々な数値をビジュアルに表現するダッシュボード機能が標準で装備されています。この意味では、現在のプロセスマイニングツールは、「プロセスインテリジェンスツール」と言い換えても全く支障がないと言えます。


The term “Process Intelligence” is often used in process mining documentation and vendor information.

The definition of “Process Intelligence” varies from vendor to vendor, but there is no clear definition, therefere many people are confused about how it differs from process mining.

In this article, I would like to explain the relationship and differences between “process mining” and “Process Intelligence”, explaining “Business Intelligence” at the same time.

In fact, the relationship between the two is clear, as illustrated in the “process mining manifest” published in 2011.

As you can see, the largest frame is the “Business Intelligence”, inside which is the “Process Intelligence”, and inside which is the “process mining”. They are nesting relationships.

Business intelligence is literally the collection and analysis of all the business related data and information. The analysis is often conducted using so-called BI tools, typically starting from financial data such as sales and profits, we look at trends by fiscal year, month, and week, and drill down by area and product to delve into the areas and product categories that contribute to sales and profits, as well as the factors that are hindering them. This is business intelligence.

“Process Intelligence” is a type of business intelligence analysis that focuses on data and information related to business processes. Furthermore, “process mining” is an analytical method based on the flow of business process, or “Control Flow” in process intelligence.

Some people say that since process mining is basically included in business intelligence, can it be replaced by business intelligence?

However, the basic function of process mining, “(automatic) Process Discovery” requires a special algorithm that BI tools typically do not equipped with. And it is not practical to build algorithms for process mining based on BI capabilities from scratch (Even if you could build an elementary one, the process model that you reproduced would be unreliable.)

Therefore, if you want to do process mining, you need to use a dedicated process mining tool, which BI cannot replace.

So where does process intelligence cover?

In addition to process discovery using special algorithms, the Process Mining Tool calculates various statistical values and presents them in various tables and graphs.

For example, the number of issues involved in the process being analyzed, the throughput from start to finish of the process (cycle time), the number of activities per activity, the processing time, the transition time (path time) from one activity to another, or the wait time. The average, maximum and minimum, median, and standard deviation of these values can also be checked.

These statistics can be calculated on the basis of simple arithmetic operations without the need for special algorithms. It’s easy to do with BI. That’s where “Process Intelligence” covers.

In the process mining analysis, based on the “process model” (as is process model) discovered through the algorithm, various variations are verified “variant analysis”, and comparative analysis with ideal processes (to be Process), that is, conformance checking, is performed.

In addition, identify problem activities where processing time exceeds KPIs and bottlenecks where waiting time is too long. Basic statistics such as number of processes, processing time, and waiting time are important.

In other words, process mining involves drilling down into process intelligence figures from various perspectives in conjunction with process models.

The major process mining tools have standard process intelligence capabilities with dashboards that visually represent various numbers, as well as algorithms for creating process models. In this sense, it is safe to say that the current process mining tools are “process intelligence tool”.