
Standard Procedure of Process Mining Analysis
English follows Japanese. Before proofread.
当記事では、プロセスマイニングツールを活用して、どのように対象プロセスの分析を行っていくのかについて、標準的な手順を解説します。
以下の点、あらかじめご留意ください。
・分析を行う流れは、本来直線的なものではありません。基本的には、様々な分析の切り口を行ったり来たりする繰り返し作業を通じて深めていくものです。とりわけ、大量、かつ複雑なイベントデータからの分析から、新たな知見を引き出そうとするプロセスマイニング分では試行錯誤が不可欠です。「こうやれば新たな知見が発見できる」という分析の必勝パターンは存在しません。
活用する分析ツールによって機能には違いがあります。また、機能に対する名称も異なります。当記事では一般的な表現を用いています。利用されているツール独自の表現については、機能的に類似なものに読み替えてください。
さて、基本的なプロセスマイニングの分析手順は次の通りです。
1 分析対象プロセスに関する統計数値の確認
2 バリアント分析
3 頻度分析
4 パフォーマンス分析
5 リワーク分析
6 問題点検討会開催
7 根本原因分析
8 改善施策の立案
9 改善プロセス作成/改善効果シミュレーション
10 レポート作成
それでは、各手順の分析内容を概説していきましょう。
なお、 プロセスマイニングツールには、データ前処理済の「イベントログデータ」がアップロードされ、分析項目の紐づけ(マッピング)も済んで、分析準備は完了しているところからの説明になります。
1 分析対象プロセスに関する統計数値の確認
プロセスマイニングツールの分析実行ボタンを押して分析スタートです。デフォルト画面はツールによって異なりますが、まずは分析対象プロセスに関して、以下のような基本的な統計数値が表示されている画面を確認します。データの概要を把握するためです。
- 分析対象案件数(ケースID数)
- 完了案件数・未完了案件数
- 分析対象アクティビティ数(延べアクティビティ数)
- 案件あたり平均/最多/最少アクティビティティ数
- アクティビティ別発生件数
- 分析対象期間(FROM: yyyy/mm/dd TO: yyyy/mm/dd)
- 平均/最長/最短/中央/最頻度スループット(時間表示)
- スループット分布(ヒストグラム)
- スループット標準偏差
上記の数値を確認する際の一番の留意点は、「完了案件のみを分析するかどうか」の判断です。完了案件とは、分析対象期間内において、「開始アクティビティ」と「終了アクティビティ」の両方が含まれているものを意味します。
問題が実際のイベントログでは、期間前に開始アクティビティが始まっていたり、また、分析期間内に「終了アクティビティ」に到達していない案件が含まれています。これらの「未完了案件」をそのままにしておくと、スループットの算出に問題が生じます。
基本的にはフィルター機能を活用して、分析期間内に「開始アクティビティ」と「終了アクティビティ」の両方が含まれているものだけを分析対象とする設定をこの時点で行いましょう。(もちろん、分析目的によっては未完了案件を分析対象とすることもあります)
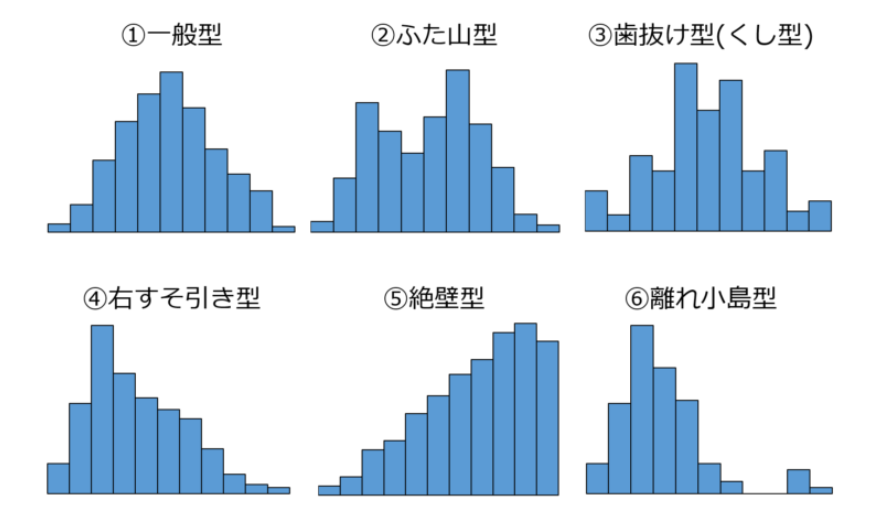
また、スループットについては、平均、最多、最少、中央、最頻度の数値だけでなく、ヒストグラムによる分布状況を確認しましょう。プロセスデータの場合、正規分布しているケースはほとんどありません。
また、山が複数存在する「多峰型」のヒストグラムの場合、同じプロセスではあっても、すべてのプロセスを経由する案件と、なんらかの条件で途中のプロセスを省略した簡易プロセスの案件がごっちゃになっている可能性があります。(これは、次のバリアント分析で明確に識別すべきポイントです)
2 バリアント分析
分析対象プロセスの流れは、ビジネスルールによる分岐(たとえば、ローンの申請結果に基づいて、その後の流れは、承認と非承認の2つの流れに分かれるなど)や、前工程への差戻しや、繰り返し業務、逸脱などのアクティビティが存在することによって複数のパターンが発生します。
つまり、開始アクティビティから終了アクティビティまでの経路には様々なバリエーションがあるということです。バリアント分析では、このバリエーションそれぞれを確認することを通じて、典型的な流れや、逸脱が含まれるパターンの発見を行います。
バリアント分析でまず着目するのは、最も案件数の多いプロセスパターンです。このプロセスを「ハッピープロセス」、または「ハッピーパス(経路)」と呼ぶ場合もありますが、処理案件数が多いからといって必ずしもそれが最も理想的なプロセスとは限りません。
そこで、プロセスオーナーやドメインエキスパート(現場担当者)に確認して、そもそも問題のない理想的なプロセス=ハッピープロセスが何かを確認します。
また、ビジネスルールなどによって、途中から流れが大きく分岐するプロセスパターンが複数存在する場合、それぞれのパターンごとにもハッピーパスが存在すると考えられます。
一方で、上記理想プロセスに照らして逸脱していると考えられるプロセスパターンを洗い出し、記録に残しておきます。これらは問題点として提起すべきものになります。
なお、逸脱プロセスの発見のためにさらに「コンフォーマンス分析」を行うことも有効ですが、これは標準ではなく応用分析と位置付けています。
3 頻度分析
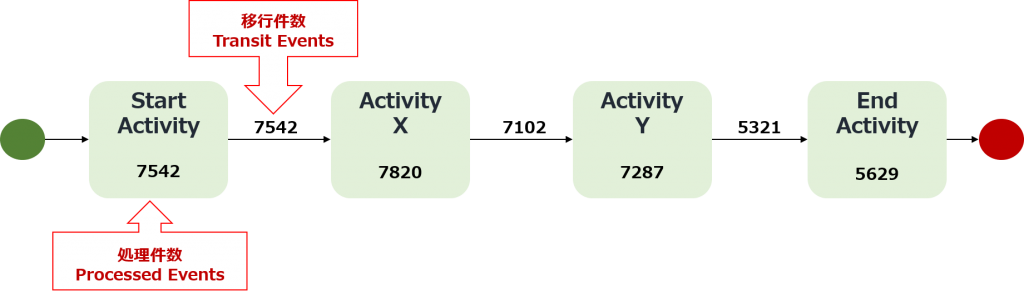
プロセスモデル、すなわちプロセスの流れを示したフローチャートの表示画面において標準的に示されている数値が、プロセスに含まれる各アクティビティの処理件数や、あるアクティビティから別のアクティビティに流れた件数です。
これらの処理件数を細かく検証していくのが頻度分析です。着目ポイントとしては、もちろん処理件数の多い箇所です。処理件数が多いということはそれだけ、現場担当者の負荷が大きく、処理時間が長くなったり、案件が滞留するボトルネックが発生しやすい箇所になるからです。
4 パフォーマンス分析
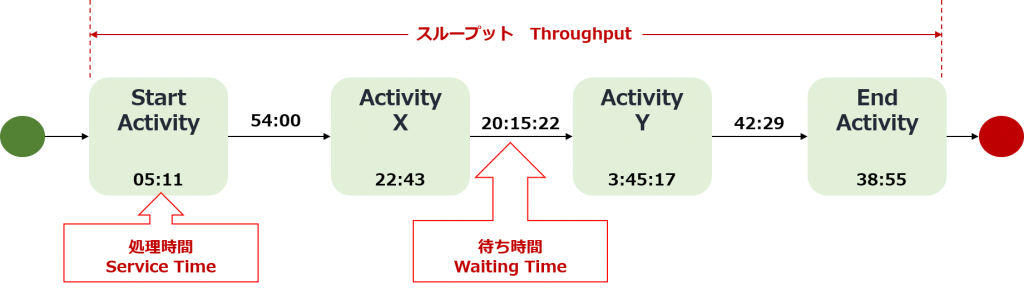
パフォーマンス分析は、基本的に「時間」尺度の分析です。プロセスの開始アクティビティから終了アクティビティまでの総所要時間(トータルリードタイム)、すなわちスループット、および、各アクティビティの処理時間、あるアクティビティから別のアクティビティまでの移行時間=待ち時間などをつぶさに見て、時間がかかりすぎている非効率な箇所、待ち時間が長い「ボトルネック」を発見します。
パフォーマンス分析において重要なのは、時間が長い・短いを判断するための基準値を明確にしておくことです。たとえば、スループットの場合、平均、または中央スループットを基準にして、それよりも長いプロセスにおいては、「全体的に時間がかかりすぎている」という問題があるとみなします。
また、各アクティビティごとの処理時間や待ち時間についても、平均値または中央値を基準値として設定するか、また、本来、この程度の時間であるべきというKPI(Key Performance Indicator)の目標値に照らして問題点を抽出することが有効です。
5 リワーク分析
リワーク、すなわち繰り返し業務は少ないほうが好ましく、リワークが発生している箇所には、非効率な手順や、リワークを誘発しやすい問題が潜んでいる可能性があります。
リワークには、大きくは、あるアクティビティが繰り返し行われている場合と、複数のアクティビティの流れが繰り返されている場合の2つがあります。前者は単純なエラーや反復業務が含まれている可能性、また後者は「手戻り」が発生しているということですから、ここにもなんらかの原因が存在しています。
リワーク分析で浮き彫りになった問題個所もまた、次の「問題点抽出」のひとつとして根本原因追求を行うことになります。
6 問題点検討会開催
バリアント分析、頻度分析、パフォーマンス分析、リワーク分析を通じて抽出した問題点を列挙して、関係者による検討会を行います。
プロセスオーナー、およびドメインエキスパート(現場担当者)に、分析結果を示しつつ、以下のような問題と想定される箇所についての確認を行います。
- 特定のアクテイビティやフローにおいて処理件数が多くなっている原因
- スループットが基準値よりも長い(あるいは短い)プロセスとなる原因
- 基準値よりも、アクティビティの処理時間や待ち時間が長い箇所が発生する原因
- 標準的な手順には含まれていない逸脱手順、あるいは省略されている手順が発生している理由
- リワークが発生している理由
プロセスオーナーやドメインエキスパートに確認した結果、逸脱手順と想定されたが現実には所定の手順であったとか、ある箇所において処理時間が長くなるのは現実に照らして問題がない、という判断になることもあるでしょう。
プロセスマイニング分析であぶりだされる問題は、あくまで現象としての問題ですから、それが本当に企業に悪影響を与える問題であるのか、また是正すべきなのか、また是正可能なのか、ということを判断するためには、現実のプロセスをよく理解している関係者へのヒアリングを通い、「解決すべき本当の問題」のみを残していくことが不可欠です。
7 根本原因分析
問題点の検討に続いて、根本原因を解明していくための深堀り分析を行います。プロセスマイニング分析においては、様々な属性によるクロス分析を通じて、問題の手がかりを探ります。
どのような属性による分析を行うべきかは対象プロセスによって異なりますが、一般的には以下のような属性分析が有効です。
- サプライヤ別
- 顧客(タイプ)別
- 製品別
- 資材別
- 調達部門別
- エリア別
- 調達金額別
- 受注金額別
たとえば、購買プロセスにおいては、どのサプライヤの場合に、あるいはどの資材調達の場合にリワークが発生しやすいのか、また、どのような条件においてビジネスルールが適用されるのか、そのビジネスルールは適切に運用されているのか、といった分析を行うことで根本原因に近づいていくことはできます。
ただ、最終的に現場担当者の手作業が非効率の原因となっているような場合、イベントログでは記録されていない業務であるため、データ分析だけでは真因に迫ることはできません。
したがって、根本原因分析においては、現場担当者のヒアリングやワークショップ、観察調査などを併用して、データ有無にこだわらず、根本原因を探るためのあらゆる手段を講じることが必要になるでしょう。
8 改善施策の立案
解決すべき本当の問題、およびその問題の根本原因が明らかにできたら、いよいよ改善施策を立案を行います。改善施策案の原案は、たとえばプロセスアナリストやビジネスコンサルタントが作成しますが、どの改善施策が有効であるのか、また最優先で取り組むべきなのかは、プロセスオーナーやドメインエキスパートを含む検討会で決定すべき事項です。
なお、どのようなプロセス改善を行うかは当然ながらケースバイケースですが、標準的なアプローチとしては以下のようなものがあります。
- 業務手順の組み直し
- 問題アクティビティの除去
- アクティビティの統合
- 複数アクティビティの並行処理化
- 人員配置の適正化
- 自動化
9 改善プロセス作成・効果シミュレーション
取り組むべき改善施策が立案されたら、その改善施策が実施された場合の「改善プロセス」を作成し、可能な範囲でシミュレーションを行います。現行プロセス(as isプロセス)と改善プロセス(to beプロセス)でどの程度、処理件数が軽減できたり、所要時間やコストが削減できるかを検証するわけです。
なお、改善プロセスの作成は、モデリングツールを用いて「BPMN準拠」のフローを作成すべきでしょう。プロセスマイニングツールのなかには、BPMN準拠のモデリング機能が含まれているものがあります。含まれていない場合は、別途モデリングツールを準備することになります。
10 レポート作成
これまでの分析内容や、改善施策案に基づく改善プロセス、およびその効果検証シミュレーションの結果を取りまとめてレポートを作成します。レポートの一般的なタイトルは
「XXXプロセスのプロセスマイニング分析レポート – 問題点と解決策」
といったところです。
なお、分析プロジェクトの目的や状況によって、改善施策の立案の前の段階まで、すなわち問題点の抽出までのレポート作成になる場合もあるでしょう。
This describes standard procedures on how to analyze target processes using a process mining tool.
Please note the following points in advance.
- The flow of analysis is not usually linear, but is basically deepened through iterative work of going back and forth between various aspects of analysis. In particular, trial and error is indispensable for process mining to extract new insights from analysis of large and complex event data. There is no victory pattern in the analysis that “you can discover new insights in this way”.
- The features vary depending on the analysis tool used. Also, the names for the functions are different. This article uses general expressions. For the unique expression of the using tool, regard it with a functionally similar to the described one.
Now, the basic process mining analysis procedure is as follows.
1 Confirmation of statistical figures for the process to be analyzed
2 Variant analysis
3 Frequency analysis
4 Performance Analysis
5 Rework analysis
6 Problem evaluation meeting
7 Root-cause analysis
8 Planning improvement measures
9 Improved process model creation / effect simulation
10 Report making
Let’s outline the content of each step.
In addition, it is assumed that data pre-processed “event log data” is uploaded to the process mining tool, analysis items are linked (mapping), and analysis preparation is completed.
1 Confirmation of statistical figures for the process to be analyzed
Start the analysis by pressing the analysis execution button of the process mining tool. The default screen varies depending on the tool, but first check the screen showing the following basic statistical values for the process to be analyzed. To get an overview of the data.
- Number of Items to be analyzed (number of case IDs)
- Number of completed projects / number of uncompleted projects
- Number of activities to be analyzed (total number of activities)
- Average / most / least number of activities per issue
- Number of occurrences by activity
- Analysis target period (From: yyyy/mm/dd To: yyyy/mm/dd)
- Average / longest / shortest / central / most frequent throughput (time)
- Throughput distribution (histogram)
- Throughput standard deviation
The most important point to keep in mind when checking the above figures is whether to analyze only completed projects. A completed matter means one that includes both “start activity” and “end activity” within the analysis period.
In the event log where the problem is in fact, there are cases where the start activity has started before the period, and the case where the “end activity” has not been reached within the analysis period. Leaving these “uncompleted items” as they are will cause problems in calculating the throughput.
Basically, make use of the filter function and set the analysis target at this point only for those that include both “Start activity” and “End activity” within the analysis period. (Of course, depending on the purpose of analysis, incomplete projects may be analyzed.)
As for throughput, let’s check not only the average, maximum, minimum, center, and most frequent values, but also the distribution status using histograms. In the case of process data, there are almost no cases of normal distribution.
Also, in the case of a “multi-peak” histogram with multiple mountains, even if the process is the same, the case that goes through all processes and the case of a simple process in which the middle process is omitted under some conditions become jumbled. You may have (This is a point that should be clearly identified in the next variant analysis)
2 Variant analysis
The flow of the process to be analyzed can be divided by business rules (for example, the subsequent flow is divided into two flows of approval and non-approval based on the result of loan application), return to the previous process, and repetitive operations , Deviations and other activities trigger multiple patterns.
This means that there are various variations in the path from the start activity to the end activity. Variant analysis examines each of these variations to find typical flows and patterns that include deviations.
The first thing to look at in variant analysis is the process pattern with the largest number of issues. This process is sometimes referred to as a “happy process” or “happy path (route)”, but the large number of processed cases does not necessarily mean that it is the most ideal process.
Therefore, check with the process owner or domain expert (site staff) to confirm what is the ideal process without any problems = happy process.
Also, if there are multiple process patterns where the flow diverges in the middle due to business rules, etc., it is considered that a happy path exists for each pattern.
On the other hand, process patterns that are considered to deviate from the ideal process described above are identified and recorded. These are issues to raise.
Note that you can also use “conformance Checking” to find deviations. However, this functionality can be regarded as an advanced analysis, not standard.
3 Frequency analysis
The numerical value that is standardly shown in the process model, that is, the display screen of the flowchart that shows the process flow, is the number of processes of each activity included in the process and the number of processes that flowed from one activity to another activity.
Frequency analysis is a detailed examination of the number of cases processed. The point of interest is, of course, the location with a large number of processing cases. The large number of cases is that the load on the site staff is large, the processing time is long, and bottlenecks in which matter stays are likely to occur.
4 Performance Analysis
Performance analysis is essentially a “time” scale analysis. Looking at the total required time from the start activity to the end activity of the process, that is, the throughput, the processing time of each activity, the transition time from one activity to another activity = waiting time, etc. Find efficient locations and “bottlenecks” with long wait times.
It is important for performance analysis to have a clear reference value for determining whether time is long or short. For example, in the case of throughput, longer processes based on average or central throughput are considered to have the problem of “overall overall time”.
Also, for the processing time and waiting time for each activity, set the average value or the median value as the reference value, or compare it with the target value of the KPI (Key Performance Indicator), which should be about this time. It is effective to extract the problem.
5 Rework analysis
Rework, that is, less repetitive work is preferable, and where rework occurs, there may be inefficient procedures or problems that can easily trigger rework.
There are two main types of rework: when an activity is repeated, and when multiple activities are repeated. The former is likely to involve simple errors and repetitive tasks, and the latter is because “rework” has occurred, so there are some causes here as well.
The problem spots highlighted in the rework analysis will also be pursued as root causes as one of the next “problem extractions”.
6 Problem evaluation meeting
Issues enumerated through variant analysis, frequency analysis, performance analysis, and rework analysis are enumerated, and a stakeholder evaluation meeting should be held.
While showing the analysis results to the process owner and the domain expert (on-site staff), confirm the following problems and potential parts.
- The cause of the large number of transactions for a specific activity or flow
- The cause of the process that the throughput is longer (or shorter) than the reference value
- Causes where the processing time or waiting time of the activity is longer than the reference value
- Reason for occurrence of deviated or skipped procedure not included in standard procedure
- Reason for reworks
As a result of checking with the process owner or domain expert, it was determined that the procedure was a departure procedure, but it was actually a predetermined procedure, or that a longer processing time at a certain place was not a problem in reality.
The problems that are revealed in the process mining analysis are phenomenal problems only, so it is necessary to determine whether they are problems that have a real negative effect on the company, should be corrected, or can be corrected. To do so, it is essential to leave only “real problems to be solved” through interviews with stakeholders who understand the real process well.
7 Root-cause analysis
After examining the issues, we will conduct a deep analysis to elucidate the root cause. In process mining analysis, we look for clues to problems through cross-analysis with various attributes.
Which attribute should be analyzed depends on the target process, but the following attribute analysis is generally effective.
- By supplier
- By customer (type)
- By product
- By material
- By procurement department
- By area
- By purchase price
- By Order price
For example, in the purchasing process, which supplier or material procurement is likely to cause rework, and under what conditions business rules are applied, the business rules are properly operated. Analysis can help you get closer to the root cause.
However, in the event that the manual work of the field staff ultimately causes inefficiency, it is a task that is not recorded in the event log, so the data analysis alone can not approach the true cause.
Therefore, in root cause analysis, it will be necessary to take all means to find the root cause, regardless of the presence or absence of data, in combination with interviews, workshops, observational surveys and the like of field staff.
8 Planning improvement measures
Once you have identified the real problem to be solved and the root cause of the problem, you can finally make improvements. The draft of the improvement plan is created by, for example, a process analyst or business consultant.Which improvement plan is effective and which should be given the highest priority is determined by a study group including process owners and domain experts. It is a matter to be done
Of course, what kind of process improvement should be done is case-by-case, but the following are standard approaches.
- Reorganization of business procedures
- Removal of problem activity
- Activities integration
- Parallel processing of multiple activities
- Optimization of staffing
- Automation
9 Improved process model creation and effect simulation
After the improvement measures to be taken are drafted, create an “improvement process” when the improvement measures are implemented, and simulate as much as possible. It examines how much the number of processes can be reduced, and how much time and cost can be reduced with the current process (as is process) and the improvement process (to be process).
When creating an improvement process, you should create a “BPMN compliant” flow using a modeling tool. Some process mining tools include BPMN-compliant modeling capabilities. If not, you will need to prepare a separate modeling tool.
10 Report making
A report is created that summarizes the results of analysis up to now, the improvement process based on improvement measures, and the results of the effect verification simulation. A common report title is
“Process Mining Analysis Report for XXX Process-Problems and Solutions”.
Depending on the purpose and situation of the analysis project, the report may be created up to the stage before the planning of the improvement measures, that is, until the problem is identified.