Organizing the functionality of a process mining tool based on the purpose of analysis
Process mining tools that perform analysis based on event logs are basically very versatile and are evolving with new features being added every day. It’s not easy to get an overview of the features of a process mining tool when you’ve just been given a one-size-fits-all explanation or demo.
So, in this article, let’s start with what kind of analysis you want to do, that is, the “purpose of the analysis”, and organize what kind of function it has.
Please note that we have deliberately left out task mining because it is a technologically immature feature and we are focusing on the main features.
Now, there are many ways to analyze using process mining tools, but I would like to divide them into the following four main categories.
1 Process Focus
This is the basic analytical perspective of process mining. The analysis focuses on the flow of the target process.
2 Organizational Focus
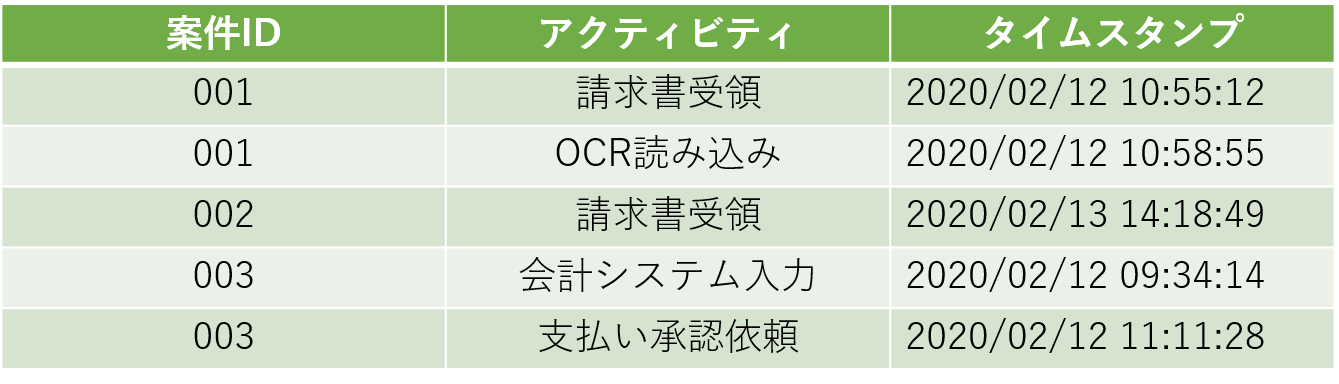
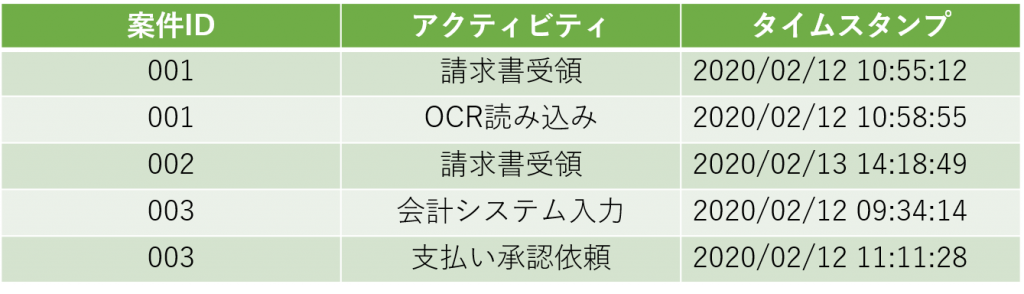
The three required data items for process mining analysis are process ID, activity, and time stamp. In addition to these three items, “resource (user in charge)” and “role (department and position)” are typically analyzed as semi-requisite items.
In addition to the process itself, the Organizational Focus analyzes the process from the perspective of the people in charge of executing the process and their departments and positions.
This approach is sometimes referred to as “organizational mining”.
3 Simulation Focus
Literally, it’s an approach to simulating by setting up some parameters.
4 Operational Focus
Process mining analysis is essentially an approach that targets previously completed data, but analyzes currently running and uncompleted processes in real time.
Let’s take a look at the analysis objectives and corresponding functions for each cut.
1 Process Focus
1.1 I want to know what the variations of the process are.
⇒ Variant Analysis
1.2 I’d like to see the number of cases flowing through the process.
⇒ Frequency analysis function
1.3 I want to see the time required for a process (throughput, lead time between activities, etc.)
⇒ Performance analysis function
1.4 I want to Discover deviant processes compared to standard processes (to be processes)
⇒ Conformity inspection function
1.5 I want to compare multiple process variations.
⇒ Comparative analysis function
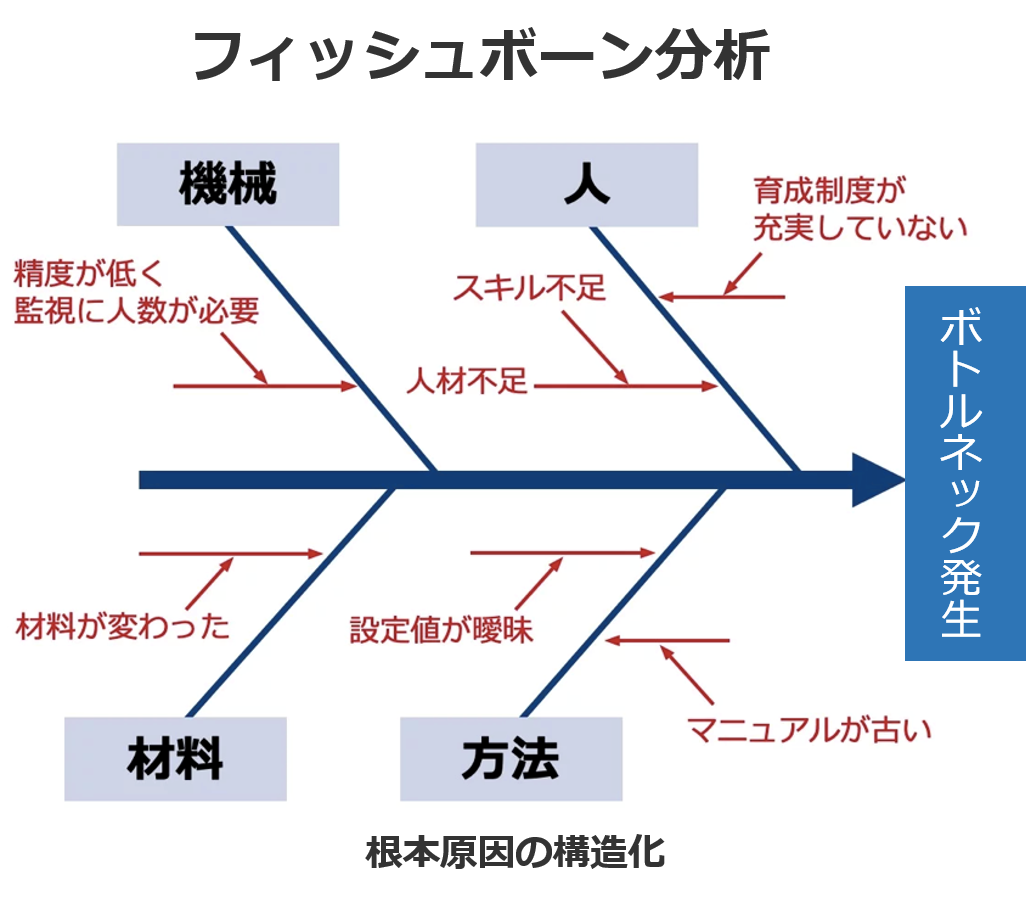
1.6 I would like to delve deeper into the causes of the problem regarding inefficiencies and bottlenecks in the process.
⇒ Root cause analysis function
1.7 I want to understand the deviation from the KPI target values (throughput, processing time, etc.).
⇒ KPI setting function
1.8 I want to understand the business rules in the process branch (gateway).
⇒ Business Rule Mining Function
1.9 I want to create a BPMN-compliant model.
⇒ BPMN model conversion function
⇒ BPMN model creation and editing functions
2 Organizational Focus
2.1 I want to know which person is in charge of which activity.
⇒ Activity Map Function
2.2 I want to calculate the number of processes and processing time for each person in charge.
⇒ Create customized dashboards
2.3 I would like to understand how those in charge of the process relate to each other in the target process.
⇒ Social network function
3. Simulation Focus
3.1 We want to verify the effects of changing a part of the process or implementing RPA.
⇒ Simulation function
4 Operational Focus
4.1 I want to estimate how much more time it will take to complete an incomplete process.
⇒ Predictive analysis function
4.2 I’d like to estimate the steps to be taken to shorten the throughput of an incomplete process.
⇒ Recommended process functions
4.3 I want to send an alert to a person in charge when a deviation process occurs.
⇒ Alert function
Above, we have organized the features of the process mining tool according to the purpose of the analysis. Please note that the function names of each tool are different.
When selecting a tool, understand how you want to analyze the process to be analyzed from the perspective of your company, and then confirm whether the candidate tool has any functions.
Introduction to Process Mining (3) Business environments which make process mining
In this article, I will explain the changes in the business environment in which process mining is becoming more important and indispensable.
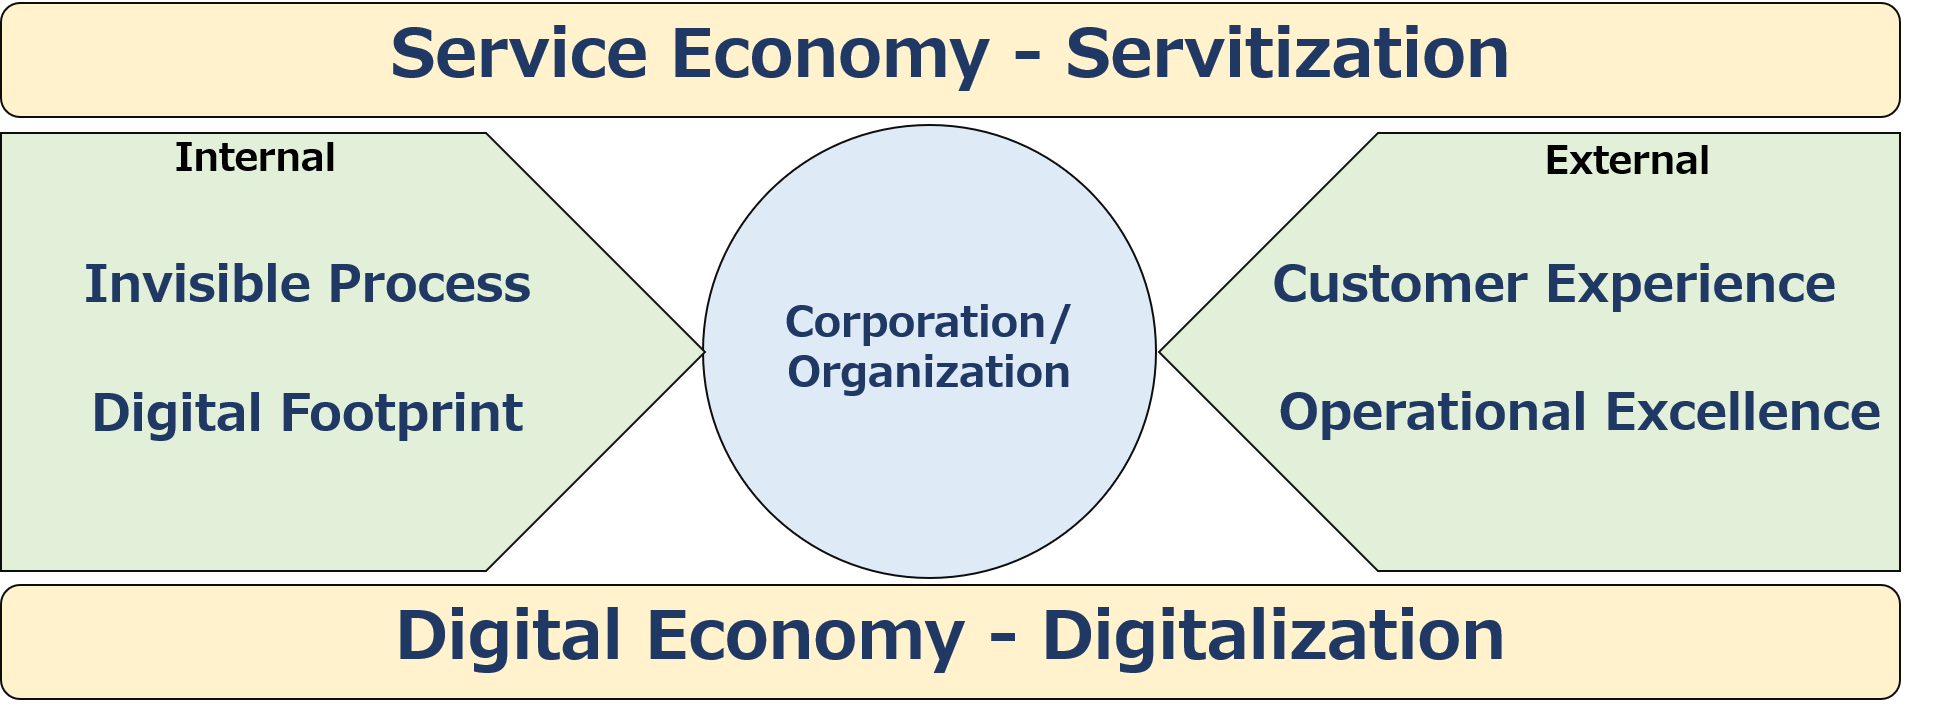
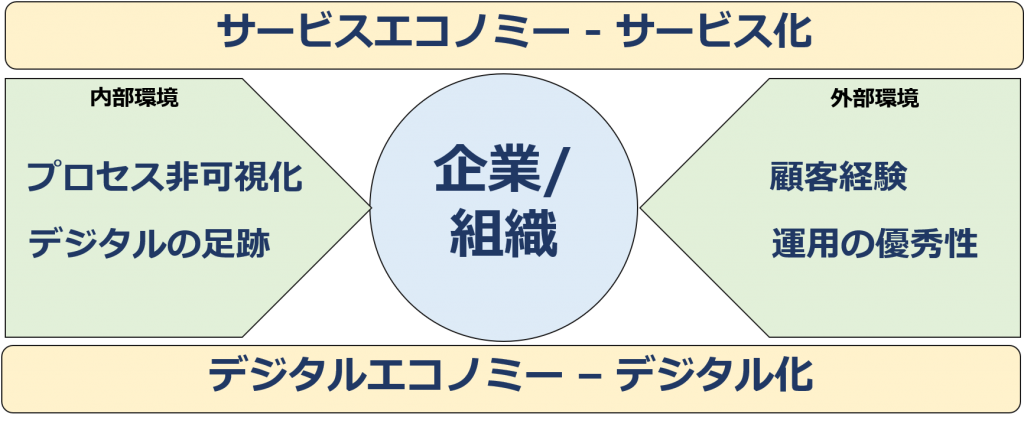
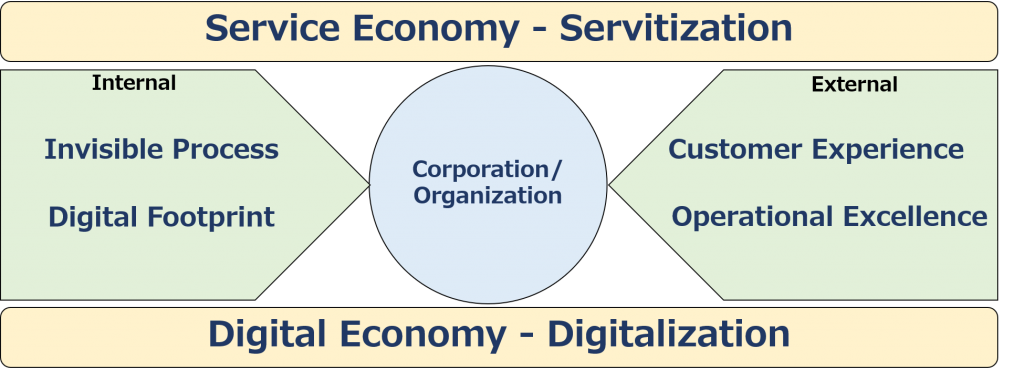
First, there are two environmental changes that I would like to list as major trends in society as a whole. It is a “service economy” through servitization, and a “digital economy” through digitalization.
Service Economy – Servitization
Economic development to date has been supported by the mass production and sale of a variety of products, mainly by the manufacturing industry. Excellent products are made in large quantities to lower the unit cost of production and are sold efficiently, mainly through wholesale and retail channels.
The important thing for manufacturers is to develop, manufacture and ship quality products, leaving the process of delivering them to consumers to the distributors. In addition, the products purchased are literally free to be used and consumed by individual households and consumers. The manufacturer was basically not involved in the use and consumption of the product and the disposal process, although it did take care of the breakdown, of course.
However, with the rise and development of various service industries outside of the manufacturing industry, as well as increased competition among manufacturers, more and more companies are offering a combination of services related to their products (e.g., installation of products, insurance, services that provide content that teaches how to use them, etc.). In other words, our approach is to provide a “total solution” that includes a variety of services, rather than a single product as an object. (Incidentally, total solution is called “whole product” in marketing.
Furthermore, it does not sell out the product, but continues to provide value for use. In other words, the form of lending for a monthly or even annual fee has been increasing in recent years. It is a so-called “subscription type”.
This shift in the quid pro quo from product to service is happening in every industry. That’s the progress of the “service economy.
Now, there are four features of the service
Intangibility:
The service is not a physical entity.
Simultaneity:
Services are consumed as soon as they are produced. For example, the services of hair cutting and styling at barber shops and beauty salons are provided to customers in real time.
Variance in Service quality:
The quality of service delivery may vary especially when there are many human factors involved. Some people may provide good service and vice versa, others may provide terrible service.
Extinguishability:
this is related to the characteristics of intangibility and simultaneity, but services disappear as soon as they are provided.
Of these characteristics, the ones that are relevant to the process are simultaneity and variability. A service is provided in real time, and each time it is provided, there is a high or low level of value or quality of service. Therefore, as a service provider, it is crucial to manage the process properly.
The Digital Economy – Digitalization
The beginning of digitalization was the lifting of the commercial ban on the Internet in 1995. Since then, a variety of services utilizing the Internet have been born one after another. Consumers can now easily use the Internet through mobile phones as well as PCs, making the use of digital devices and services in all aspects of their lives indispensable. Therefore, it can be said that the progress of digitalization has greatly facilitated the transition to services mentioned in the previous section.
In this digital economy, proper management of the processes that deliver value has become a major challenge for companies. A variety of online services are essentially “services” with the four characteristics presented in the previous section, even if they often involve the movement and consumption of products with substance. Therefore, quality control is essential, especially in the difficult situation of simultaneity and variability.
Now, let’s look at the factors that companies need to respond to in the larger macro trend of the service economy due to the increasing use of services and the digital economy due to the increasing use of digital technology.
In terms of the external environment, customer experience and operational excellence are two keywords.
Customer Experience
Customer experience is deeply related to servitization. For manufacturers, it used to be that if you made a good product and sold it, that was the end of it. Little attention was paid to how purchasers would use and consume their products.
However, they began to offer a variety of services to accompany their products, and the number of subscriptions increased. As you sell directly through your own website, it is also important to optimize the buying behavior of your prospects and the process of using and disposing of your products.
It has become necessary not only to design the specifications of the product itself properly, but also to “design the customer experience” to ensure that the customer experience associated with the product, from purchase to disposal, is the best it can be.
Operational Excellence
As the overall customer experience becomes increasingly important to consider, Operational Excellence has become increasingly important as a fundamental strategy for establishing a competitive advantage.
There are three basic strategies for establishing a competitive advantage: product leadership, customer intimacy, and operational excellence. Each company has decided on a strategic direction to focus on based on its own management resources, but the effectiveness of the “product leadership” strategy has declined as it has become increasingly difficult to differentiate the product itself. In addition, customer intimacy, which aims to form an intimate relationship with customers, is no longer sufficiently effective as a point of differentiation due to the progress of digitalization.
However, operational excellence, or “operational excellence,” has a great deal to do with the proper management of processes, but due to the increasing sophistication and complexity of products and services, it is difficult to follow a straight line, and it is easy to see the difference between companies that can do it well and those that cannot. Therefore, in order to establish a competitive advantage, it is necessary to address the operational advantage. What’s more, being able to perform well can lead to increased customer satisfaction and have a positive impact on “customer intimacy”.
Now let’s consider the internal environment. While much of the change in the internal environment of companies and organizations is due to digitalization, let’s list two key words: “process de-visualization” and “digital footprint.
Intangible process
It can be said that the development of digitalization, or the systematization of various types of business operations in companies, began with the emergence of ERP in the 1990s. As mentioned above, after the lifting of the ban on the commercialization of the Internet in 1995, the so-called “Internet Revolution”, business systemization based on Internet technology has progressed. In addition, SaaS, which can avoid huge initial development costs, such as Salesforce.com, has appeared one after another, and the operations of many companies, from large corporations to small and medium-sized enterprises, are being systematized.
The problem is that the systematization of the business has made it impossible to see how the business is done from the outside. When all the employees were in the office and working by paper, phone and fax, it was possible to know who was doing what and how they were doing it, albeit in a sensory way.
Now, however, the phones rarely ring, and employees are working in silence at their computers. When it comes to telecommuting, you can no longer visually see how your work is being done.
In other words, the digitalization of operations has made many of them invisible, making it very difficult for management to properly control progress.
Digital footprint
On the other hand, since most of the business operations have been digitized and systematized, it is possible to record the status of operations on the system exactly as data. It’s called a “digital footprint,” but by capturing, recording, and analyzing each user’s application operation history, whether it’s an application such as ERP or CRM, or office software such as Excel or Powerpoint, it’s possible to “visualize” business processes that have become invisible again.
In other words, process mining, which automatically reproduces business processes based on event logs extracted from business systems, and is useful for continuous business process improvement, has emerged as an indispensable analysis method for corporate and organizational management today and in the future.
INTRODUCTION TO PROCESS MINING IN PRACTICE – e-learning course on Udemy
Aalstn e-learning course through Udemy that will teach you the basic knowledge you need to know when implementing process mining, scheduled for early May 2020.
Target participants
Person in charge of implementing process mining in a company or organization
Consultants who are helping to implement process mining
Those who want to become an expert in process mining
Course Features
It’s not about the theoretical aspects of process mining, but more about the content that will help you successfully apply it to your business process improvement.
A comprehensive e-learning course containing process mining principles has been offered since 2014 through Coursera by the godfather of process mining, Professor Wil van der Aalst.
However, this is the world’s first practical introductory course to process mining, as it does not rely on a specific process mining tool and is not yet offered in Japan or the rest of the world as a practical e-learning course focused on business applications to improve business processes.
An English version will be released at a later date.
Benefits for participants
You will learn the basics of process mining from practical aspect.
You will be able to effectively communicate the necessity of the introduction of process mining to your supervisors and other internal stakeholders(person in charge).
You’ll be able to convincingly communicate the value of process mining to your prospects (Process Mining Consultant).
Curriculum
What is process mining?
History of Process Mining
Business environments that make process mining indispensable
Benefits and Expected Returns of Process Mining
Processes to be analyzed
Use cases
Process Mining and Related Solutions (ETL, RPA, BPMs, DWH/Datalake)
What is the event log?
Principles of Process Mining Algorithms
Four Approaches to Process Mining
process discovery
conformance check
process enhancement
Operational Support
How to manage a process mining project
Task Mining (Robotic Process Mining)
Skill sets required for process mining practitioners
process mining tool
– What is process mining – History of process mining – Business environments that make process mining indispensable – Benefits and expected returns of process mining – Target processes to be analyzed – Use cases – Process mining and related solutions(ETL, RPA, BPMs, DWH/Datalake) – What is event log – Principle of process mining algorithm – Four approaches of process mining – Process discovery – Conformance checking – Process enhancement – Operational support – How to manage a process mining project – Basics of data preparation – Task mining/Robotic process mining – Necessary skill set for a process miner – Process mining tools
Task Mining – Three Analytical Perspectives for Improving Labor Productivity.
Based on PC operation logs, “task mining” visualizes the tasks performed on each user’s PC.
In this article, let me explain the three analytical perspectives for task mining.
First, let’s be clear about the purpose of doing task mining. That is improving labor productivity.
Productivity is generally defined as
Output/Input
Then, the “labor productivity” in task mining can be expressed by the following formula;
Labor productivity = amount of value created/labor time(cost) spent
Here, labor input, if per day, would generally be 8 hours, and 40 hours per week and 160 hours per month would be the norm. (If you are on a two-days off per week).
In a nutshell, increased labor productivity is about creating more value with the hours worked. The point is not to increase value by working longer, but to increase the value you create in the same amount of time(cost).
Now, with task mining, PC operations can be recorded and accumulated in detail through sensors installed on individual PCs, allowing analysis to be performed in order to consider improvement measures to be taken to improve labor productivity.
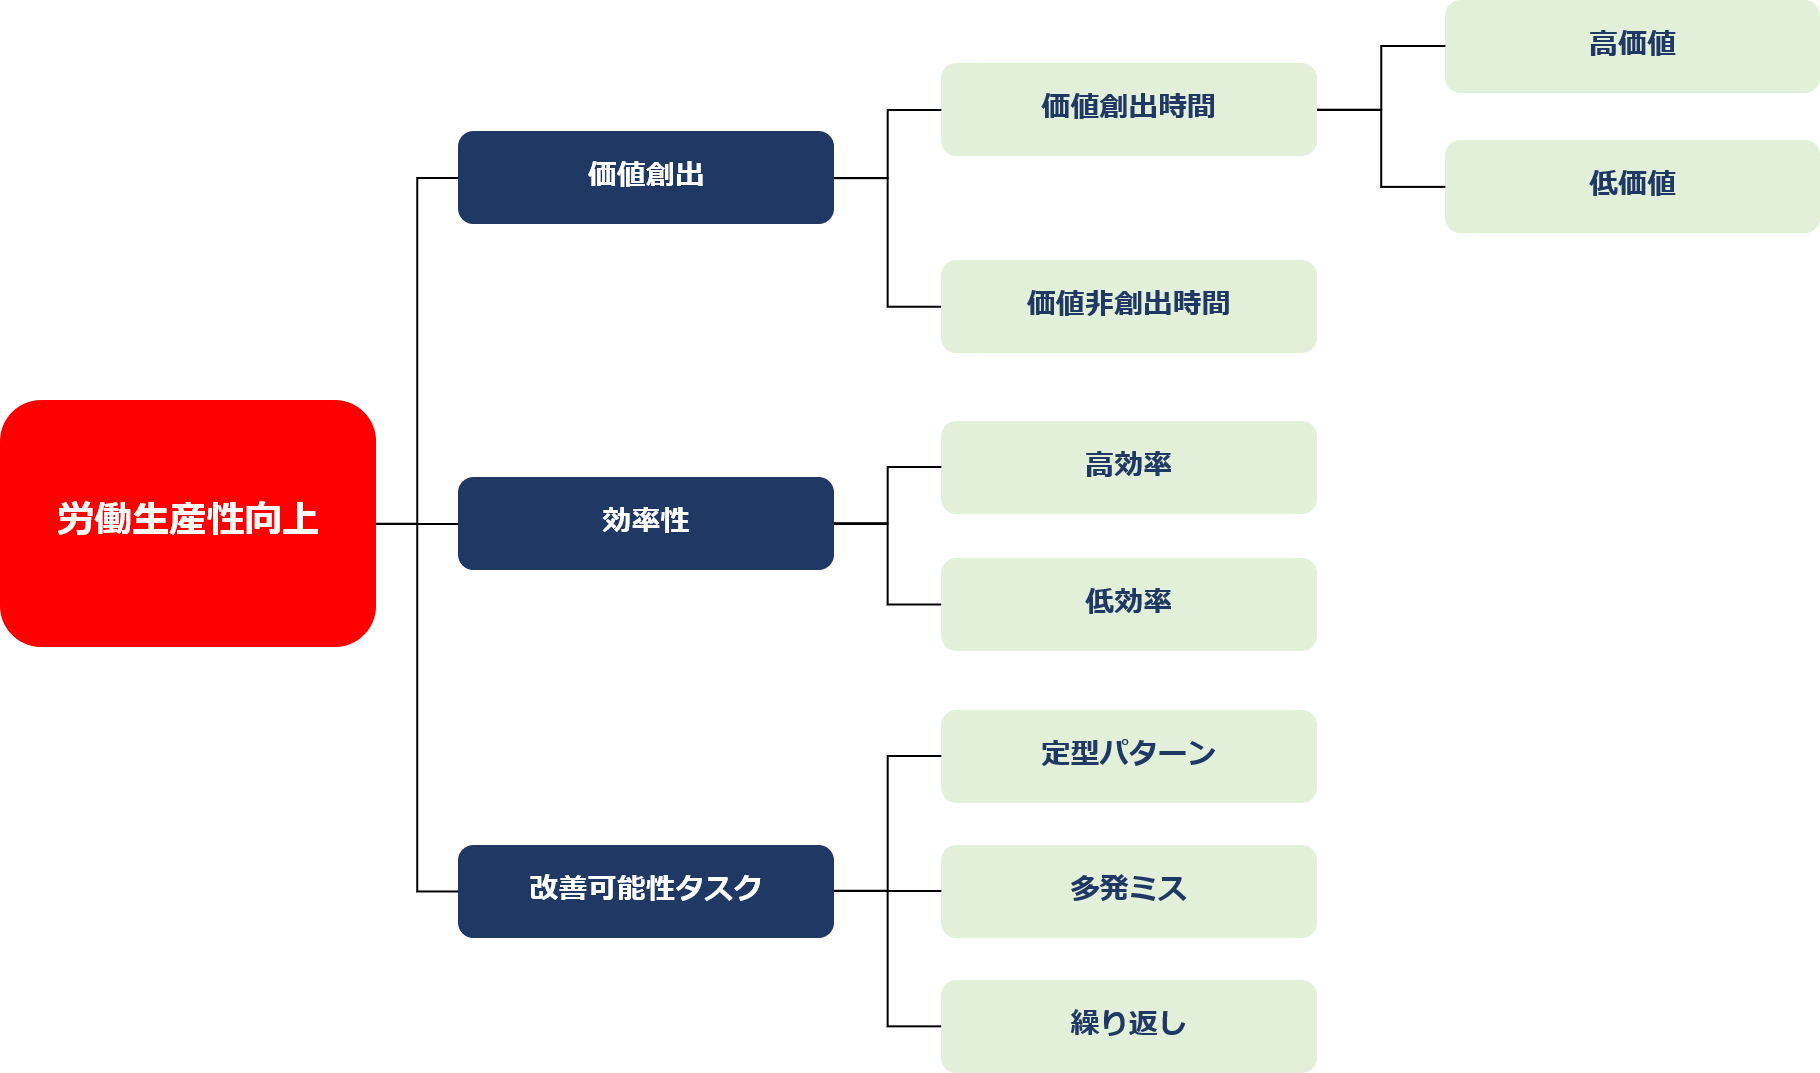
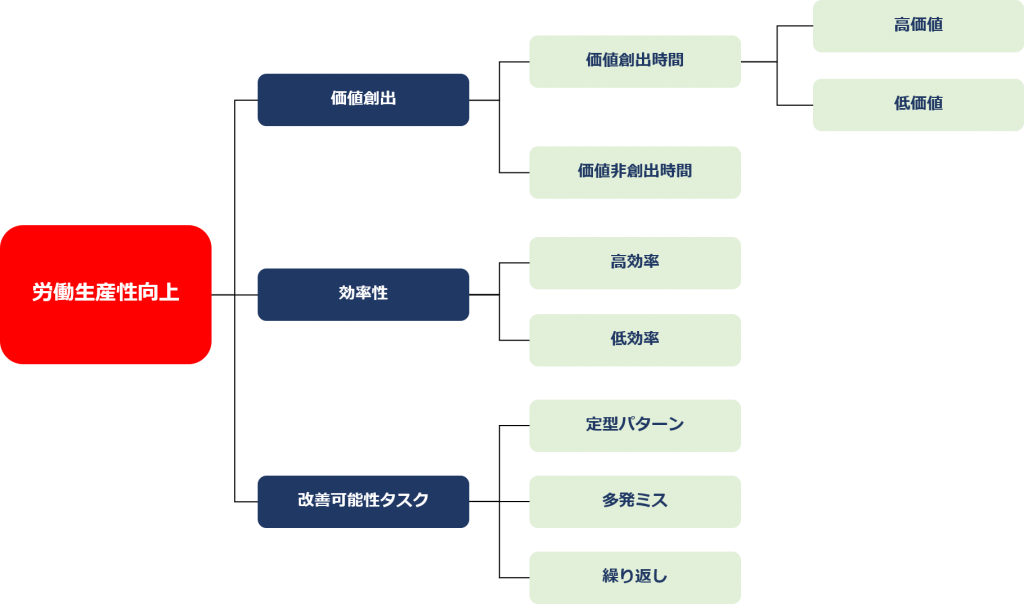
This analysis aimed at improving labor productivity includes the following three analytical perspectives
1 Created Value 2 Efficiency 3 Task to be improved
I will outline one by one.
1 Created Value
The first perspective of a task mining analysis is how much of your business time is spent engaged in value-creating activities.
As you can see from the labor productivity formula, labor is about creating value. Value, to put it plainly, is what contributes directly or indirectly to sales. In the case of factory labor, it is exactly the “product” as a result of creating the value.
In the case of various types of office work, it is not as clear as factory work, but if you are in charge of sales, preparing proposals and quotations are important value creation activities to create sales. The time that any department or business is creating value in some way is called “value creation time”.
On the other hand, time spent watching YouTube videos or just zoning out during work hours is not creating value. This is “non-value creation time. (Note that lunch and break times are not included in the analysis in the first place, as they are not business hours.)
The way to improve labor productivity is to increase value-creating activities as much as possible. However, it is assumed that the unit time of 8 hours will not be increased for a day. Therefore, it is necessary to work on how to reduce the amount of non-value-creating activities, in other words, the amount of slacking and idleness in the eight hours.
Therefore, first of all, task mining classifies business time into “value creation time” and “non-value creation time” from the perspective of value creation.
Value creation activities can also be divided into two categories. They are “high value” and “low value. High value is the aforementioned proposal and quotation writing, if you’re a salesperson. Low-value tasks include such as expense reimbursement and customer travel.
We should aim to reduce low-value operations as much as possible. For example, for expense reimbursement, you can simplify the procedure with a dedicated application, automate it with RPA, and eliminate travel time with web conferencing.
2 Efficiency
Even though they create the same value, it takes different amounts of time depending on the people who work faster or those who work slower. Therefore, after sorting out value creation and non-creation, the next step is to seek efficiency, in other words, to reduce the time to create value keeping the same value created.
When analyzing efficiency in task mining, it is necessary to set a reference value. In short, even if we do the same work, we can’t judge whether the work is highly efficient without setting some kind of evaluation criteria.
In general, this standard value is based on the average processing time by department or job category. The good thing is, unlike interview-based business analysis, task mining can be analyzed based on the actual “PC operation time”.
3 Task to be improved
The third analytical perspective of task mining will be the discovery of improvement potential tasks. While the previous two items (created value and efficiency) focus on business processing time, the improvement potential task focuses on the flow of work.
Firstly, we find and extract the tasks that we think could be improved somehow. The main targets for extraction are “routine patterns”, “multiple mistakes” and “repetition”.
A “routine pattern” is one in which several steps are taken in sequence. Day-off requests and business travel settlements are typical routine patterns. These procedures are often systematized into business systems, so they can be analyzed by process mining, but even if they are not systematized into business systems, they can be discovered by task mining. The “multiple mistakes” or “repetitions” are outliers found in the flow of app and file operations, many of which involve a large amount of “copy and paste”.
Although specific improvement measures for these potential improvement tasks may occur on a case-by-case basis, automation with RPA is the most likely solution.
Above, we have explained that in task mining, the analysis is carried out from the three perspectives of “created value,” “efficiency,” and “task to be improved”.
Task mining can also do other things, such as finding non-compliance processes that are related to compliance, but this is less relevant to improving labor productivity and will be discussed at another time.
「タスクマイニング」は、米ITアドバイザリ企業Gartnerが、『Gartner, Market Guide for Process Mining, Marc Kerremans, 17 Jun 2019』において初めて提唱した表現です。すでに、世界各国、また日本でも、「タスクマイニング」は、PC操作ログに基づく「業務可視化」のソリューション全般を含む一般名称として認知されつつあります。
一方、RPDは、2018年に、Marlon Dumas(Tartu大学教授)、Marcello La Rosa(Melbourne大学教授)らがPC操作ログ分析の研究を通じて、ひとつの方法論として提唱したものです。
Robotic Process Mining: Vision and Challenges Volodymyr Leno, Artem Polyvyanyy, Marlon Dumas, Marcello La Rosa, Fabrizio Maria Maggi
Discovering Automatable Routines From User Interaction Logs Antonio Bosco, Adriano Augusto, Marlon Dumas, Marcello La Rosa, and Giancarlo Fortino
AI for Business Process Management From Process Mining to Automated Process Improvement Marlon Dumas, University of Tartu Institute of Computer Science
What is RPD – Robotic Process Discovery?
Robotic Process Discovery (RPD) is essentially synonymous with “task mining”. That is, it collects and analyzes PC interaction Log, which is the history of the user’s operation of applications and files such as Excel, PowerPoint, and browsers on his or her own PC.
“Task mining” is an expression first proposed by US IT advisory firm Gartner in its report, “Gartner, Market Guide for Process Mining, Marc Kerremans, 17 Jun 2019”. The term “task mining” is already gaining fairly high recognition around the world and in Japan as a general name that includes all solutions for “business visualization” based on PC interaction logs.
“RPD”, on the other hand, is a methodology proposed by Marlon Dumas (Professor at Tartu University) and Marcello La Rosa (Professor at Melbourne University) in 2018 through their research on PC interaction log analysis.
In the case of task mining, it only connotes the big framework of PC interaction log analysis, but RPD shows the basic analysis procedure of PC interaction log mainly for the purpose of “automation of tasks by RPA”.
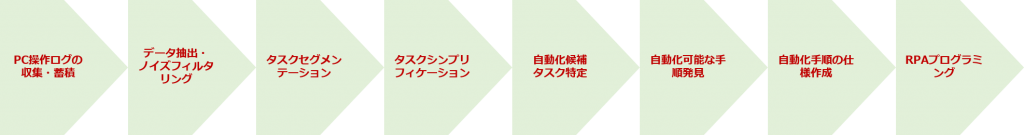
The following is an overview of how RPD proceeds to analyze the PC interaction log. The references are shown at the end.
Please note that this is a simplified version based on my original understanding. And it should also be noted that the above researchers have recently started to call it RPM (Robotic Process Mining) instead of RPD (Robotic Process Discovery), but I will use RPD in this article.
1 Collection and storage of PC interaction logs
The sensor (a light Javascript program) installed on each PC used by the user to be analyzed detects the user’s detailed activities such as launching applications, opening files, pressing the keyboard, clicking the mouse, etc., and sends the data to a designated server, where it is stored as a PC operation log.
The detailed activity captured by the sensor is called “atomic activity” because it is the smallest unit that cannot be decomposed any further.
2 Data Extraction and Noise Filtering
PC operation logs are very detailed, so called atomic activity. What’s more, there’s a lot of noise in there that can’t be analyzed, such as modified activities due to user error.
Therefore, after extracting PC interaction log data based on some conditions (target period, target PC, etc.), it is necessary to remove (filter) the noise first. In addition, if the notation on the recorded data is slightly different even though it is the same application, it will be processed as a different application, so we can unify the notation, correct garbled characters, and perform various data processing other than noise removal. This work is commonly referred to as “Data Preparation”.
3 Task Segmentation
In RPD, “segmentation” means to isolate a group of tasks from the PC operation log that are assumed to have followed a certain procedure. For example, “Copying and pasting information displayed on the browser screen into an Excel file” is a task to extract a series of tasks to accomplish some purpose, so-called “routine tasks”.
Unlike business systems (e.g., procurement systems) with pre-built business procedures, PC operation has a high degree of freedom for the user, and at a glance, PC operation logs look like they are just moving various applications and files at will, and business procedures are not clear.
Therefore, it is necessary to perform “task segmentation”, that is, to isolate only the data related to a single task from the PC operation log.
4 Task Simplification
The tasks extracted by the segmentation, such as data transcription, still contain some noise. Many of them are caused by user mistakes or parallel operation in other applications, but if you remove these noises, you can clearly understand the steps in each PC operation. The aforementioned example reveals a flow that reveals the following clear steps
Excel File Open (Excel) ⇒ Data Display Screen Access (Browser) ⇒ Data Copy (Browser) ⇒ Paste (Excel) ⇒ Data Display Screen Access (Browser) ⇒ Data Copy (Browser) ⇒ Paste (Excel)…
The finishing touches that make it possible to understand the procedure clearly are called “task simplification”.
5 Identification of candidate tasks which can be automated
From the PC interaction log data extracted for analysis, we were able to isolate multiple tasks through task segmentation and clearly understand the flow of each task through task simplification.
The next step is to consider which of these tasks are suitable for RPA automation and whether they are likely to produce a reasonable effect. At this stage, it is advisable to interview the person in charge in the field who is actually performing the candidate task in detail. (In reality, even the task segmentation and task-simplification stages can be done quickly with the help of field personnel.)
6 Automatable procedure discovery
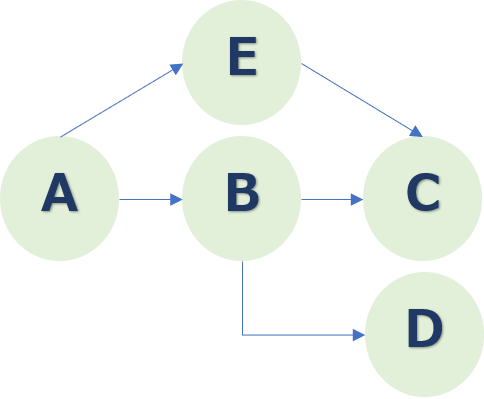
This is the stage where the scope of automation with RPA is determined. The tasks identified in the previous section as being better suited for automation are not necessarily all automatable from beginning to end.
So, we will further narrow down the steps that can be automated. For example, if the procedure of the automation candidate task identified in the previous section is [A ⇒ B ⇒ C ⇒ D ⇒ E ⇒ F], then only [C ⇒ D ⇒ E ⇒ F] is to be automated (A ⇒ B remains the current one).
7 Create specifications for automation procedures
Once you have narrowed down the steps that can be automated, consider the requirements for the automatic execution of the task by any RPA tool and create a “basic design document” for the programming in the next section.
8 RPA programming
This is to be done on an RPA tool writing an actual automation procedure. After testing in the actual environment and verifying that it works without any problems, the RPA robot is ready to go live.
Although it may not be easy to get an image of the RPD just by explaining it in words, I have explained the general procedure of RPD.
Whateve you call it, RPD, RPM or task mining, the main focus is to develop various improvement measures with the main objective of improving productivity through visualization of operations at each PC. There are a variety of specific improvement measures, but we hope you understand that RPD is an analysis method with the basic purpose of “task automation” in particular.
It should also be emphasized that RPD, or task mining, is most effective when combined with “process mining”, which visualizes business processes across multiple departments.
[References]
Robotic Process Mining: Vision and Challenges Volodymyr Leno, Artem Polyvyanyy, Marlon Dumas, Marcello La Rosa, Fabrizio Maria Maggi
Discovering Automatable Routines From User Interaction Logs Antonio Bosco, Adriano Augusto, Marlon Dumas, Marcello La Rosa, and Giancarlo Fortino
AI for Business Process Management From Process Mining to Automated Process Improvement Marlon Dumas, University of Tartu Institute of Computer Science
This describes standard procedures on how to analyze target processes using a process mining tool.
Please note the following points in advance.
The flow of analysis is not usually linear, but is basically deepened through iterative work of going back and forth between various aspects of analysis. In particular, trial and error is indispensable for process mining to extract new insights from analysis of large and complex event data. There is no victory pattern in the analysis that “you can discover new insights in this way”.
The features vary depending on the analysis tool used. Also, the names for the functions are different. This article uses general expressions. For the unique expression of the using tool, regard it with a functionally similar to the described one.
Now, the basic process mining analysis
procedure is as follows.
1 Confirmation of statistical figures for the process to be analyzed
2 Variant analysis
3 Frequency analysis
4 Performance Analysis
5 Rework analysis
6 Problem evaluation meeting
7 Root-cause analysis
8 Planning improvement measures
9 Improved process model creation / effect simulation
10 Report making
Let’s outline the content of each step.
In addition, it is assumed that data
pre-processed “event log data” is uploaded to the process mining
tool, analysis items are linked (mapping), and analysis preparation is
completed.
1 Confirmation of statistical figures for the process to be analyzed
Start the analysis by pressing the analysis
execution button of the process mining tool. The default screen varies
depending on the tool, but first check the screen showing the following basic
statistical values for the process to be analyzed. To get an overview
of the data.
Number of Items to be analyzed (number of case IDs)
Number of completed projects / number of uncompleted projects
Number of activities to be analyzed (total number of activities)
Average / most / least number of activities per issue
Number of occurrences by activity
Analysis target period (From: yyyy/mm/dd To: yyyy/mm/dd)
Average / longest / shortest / central / most frequent throughput (time)
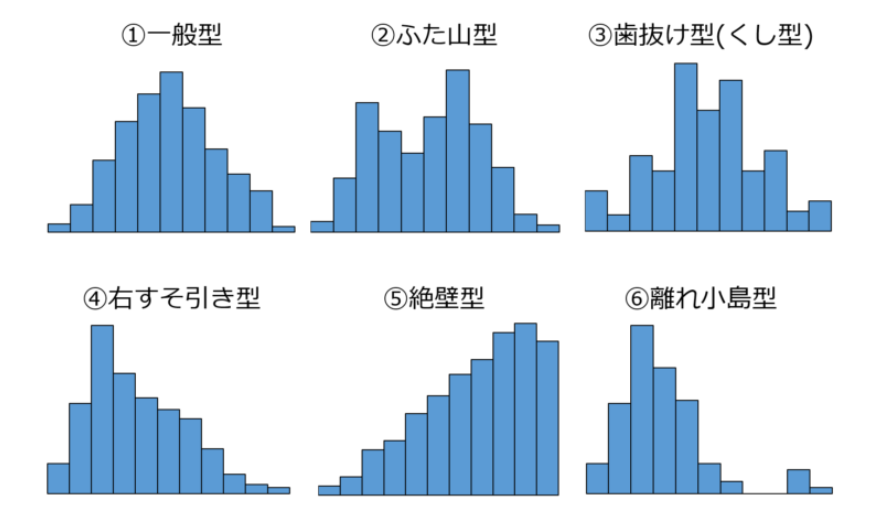
Throughput distribution (histogram)
Throughput standard deviation
The most important point to keep in mind
when checking the above figures is whether to analyze only completed projects.
A completed matter means one that includes both “start activity” and
“end activity” within the analysis period.
In the event log where the problem is in
fact, there are cases where the start activity has started before the period,
and the case where the “end activity” has not been reached within the
analysis period. Leaving these “uncompleted items” as they are will
cause problems in calculating the throughput.
Basically, make use of the filter function
and set the analysis target at this point only for those that include both
“Start activity” and “End activity” within the analysis
period. (Of course, depending on the purpose of analysis, incomplete projects
may be analyzed.)
As for throughput, let’s check not only the average, maximum, minimum, center, and most frequent values, but also the distribution status using histograms. In the case of process data, there are almost no cases of normal distribution.
Also, in the case of a “multi-peak”
histogram with multiple mountains, even if the process is the same, the case
that goes through all processes and the case of a simple process in which the
middle process is omitted under some conditions become jumbled. You may have
(This is a point that should be clearly identified in the next variant
analysis)
2 Variant analysis
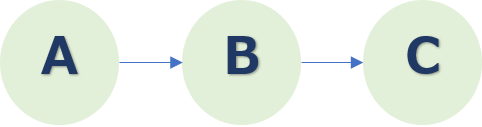
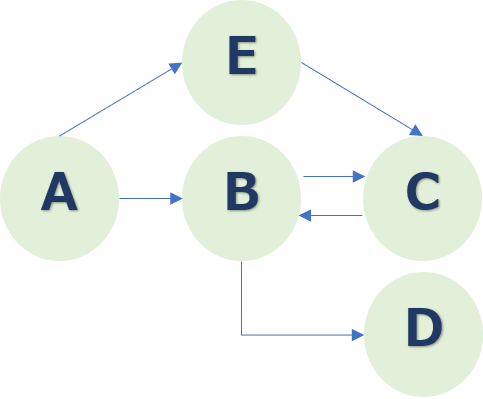
The flow of the process to be analyzed can
be divided by business rules (for example, the subsequent flow is divided into
two flows of approval and non-approval based on the result of loan
application), return to the previous process, and repetitive operations ,
Deviations and other activities trigger multiple patterns.
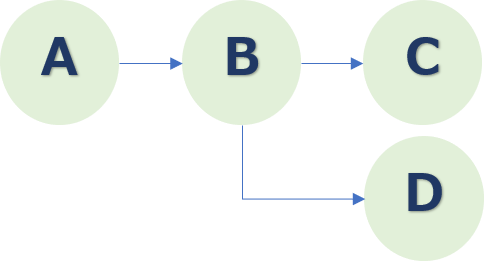
This means that there are various
variations in the path from the start activity to the end activity. Variant
analysis examines each of these variations to find typical flows and patterns
that include deviations.
The first thing to look at in variant
analysis is the process pattern with the largest number of issues. This process
is sometimes referred to as a “happy process” or “happy path (route)”, but the
large number of processed cases does not necessarily mean that it is the most
ideal process.
Therefore, check with the process owner or
domain expert (site staff) to confirm what is the ideal process without any
problems = happy process.
Also, if there are multiple process
patterns where the flow diverges in the middle due to business rules, etc., it
is considered that a happy path exists for each pattern.
On the other hand, process patterns that are considered to deviate from the ideal process described above are identified and recorded. These are issues to raise.
Note that you can also use “conformance Checking” to find deviations. However, this functionality can be regarded as an advanced analysis, not standard.
3 Frequency analysis
The numerical value that is standardly
shown in the process model, that is, the display screen of the flowchart that
shows the process flow, is the number of processes of each activity included in
the process and the number of processes that flowed from one activity to
another activity.
Frequency analysis is a detailed
examination of the number of cases processed. The point of interest is, of
course, the location with a large number of processing cases. The large number
of cases is that the load on the site staff is large, the processing time is
long, and bottlenecks in which matter stays are likely to occur.
4 Performance Analysis
Performance analysis is essentially a
“time” scale analysis. Looking at the total required time from the
start activity to the end activity of the process, that is, the throughput, the
processing time of each activity, the transition time from one activity to
another activity = waiting time, etc. Find efficient locations and
“bottlenecks” with long wait times.
It is important for performance analysis to
have a clear reference value for determining whether time is long or short. For
example, in the case of throughput, longer processes based on average or
central throughput are considered to have the problem of “overall overall
time”.
Also, for the processing time and waiting
time for each activity, set the average value or the median value as the
reference value, or compare it with the target value of the KPI (Key
Performance Indicator), which should be about this time. It is effective to
extract the problem.
5 Rework analysis
Rework, that is, less repetitive work is
preferable, and where rework occurs, there may be inefficient procedures or
problems that can easily trigger rework.
There are two main types of rework: when an
activity is repeated, and when multiple activities are repeated. The former is
likely to involve simple errors and repetitive tasks, and the latter is because
“rework” has occurred, so there are some causes here as well.
The problem spots highlighted in the rework
analysis will also be pursued as root causes as one of the next “problem
extractions”.
6Problem evaluation meeting
Issues enumerated through variant analysis, frequency analysis, performance analysis, and rework analysis are enumerated, and a stakeholder evaluation meeting should be held.
While showing the analysis results to the
process owner and the domain expert (on-site staff), confirm the following
problems and potential parts.
The cause of the large number of transactions for a specific activity or flow
The cause of the process that the throughput is longer (or shorter) than the reference value
Causes where the processing time or waiting time of the activity is longer than the reference value
Reason for occurrence of deviated or skipped procedure not included in standard procedure
Reason for reworks
As a result of checking with the process owner or domain expert, it was determined that the procedure was a departure procedure, but it was actually a predetermined procedure, or that a longer processing time at a certain place was not a problem in reality.
The problems that are revealed in the
process mining analysis are phenomenal problems only, so it is necessary to
determine whether they are problems that have a real negative effect on the
company, should be corrected, or can be corrected. To do so, it is essential to
leave only “real problems to be solved” through interviews with
stakeholders who understand the real process well.
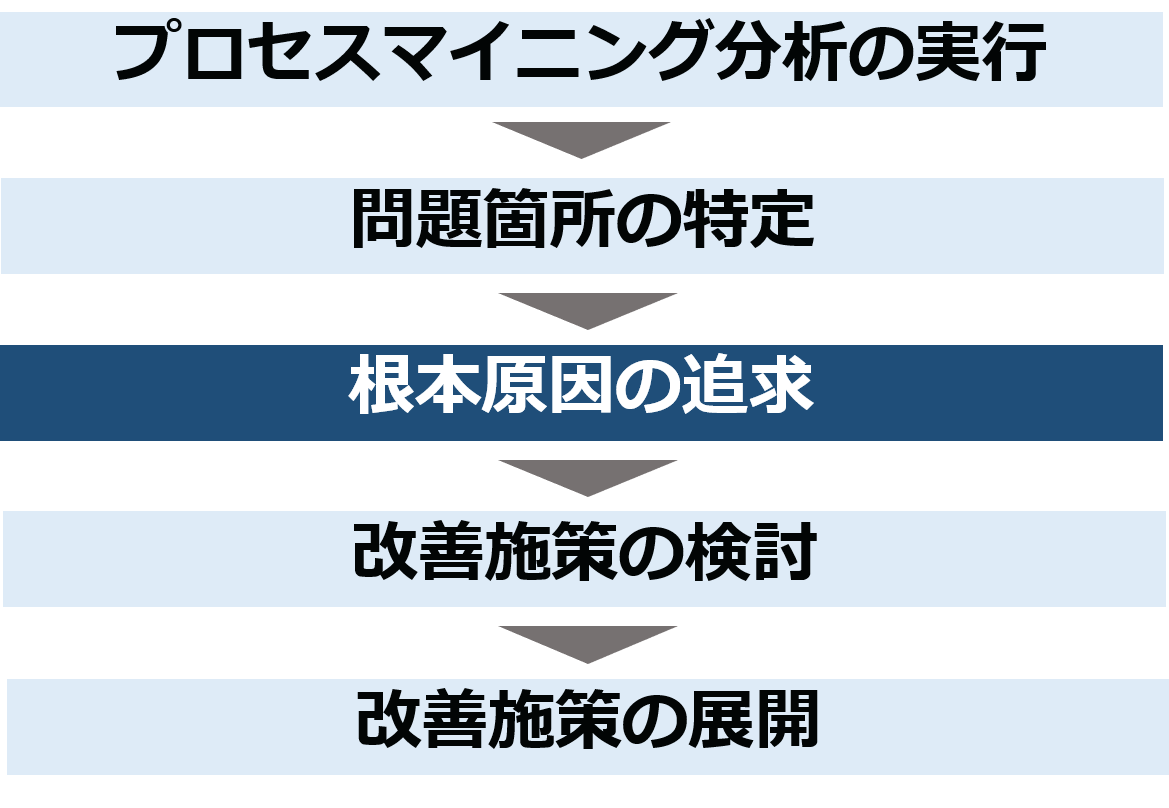
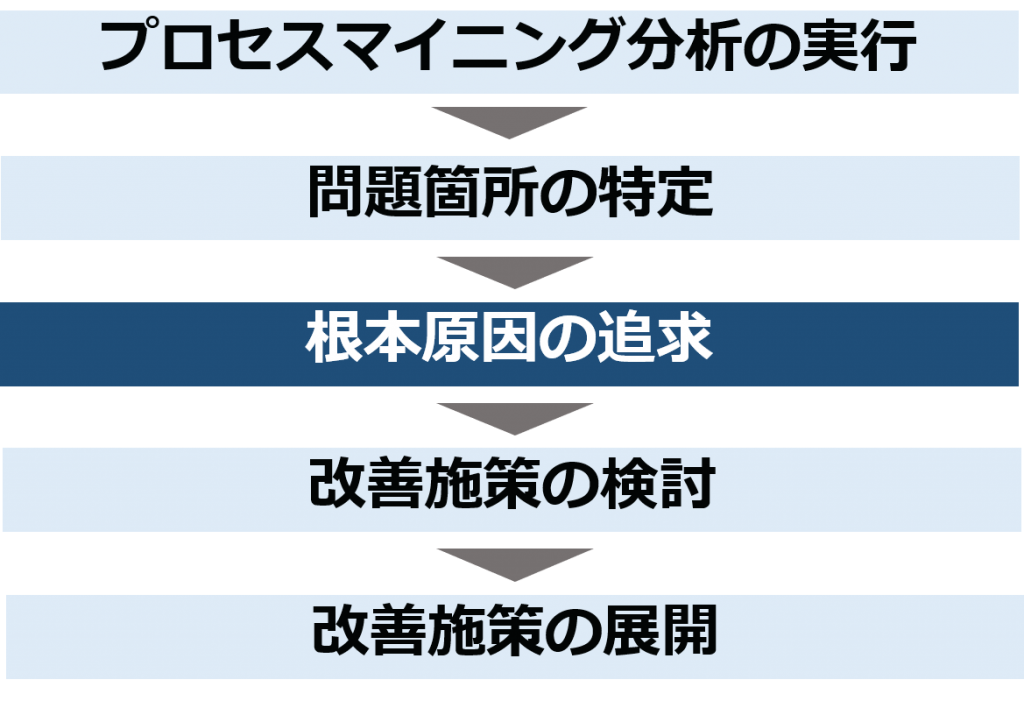
7 Root-cause analysis
After examining the issues, we will conduct
a deep analysis to elucidate the root cause. In process mining analysis, we
look for clues to problems through cross-analysis with various attributes.
Which attribute should be analyzed depends
on the target process, but the following attribute analysis is generally
effective.
By supplier
By customer (type)
By product
By material
By procurement department
By area
By purchase price
By Order price
For example, in the purchasing process,
which supplier or material procurement is likely to cause rework, and under
what conditions business rules are applied, the business rules are properly
operated. Analysis can help you get closer to the root cause.
However, in the event that the manual work
of the field staff ultimately causes inefficiency, it is a task that is not
recorded in the event log, so the data analysis alone can not approach the true
cause.
Therefore, in root cause analysis, it will
be necessary to take all means to find the root cause, regardless of the
presence or absence of data, in combination with interviews, workshops,
observational surveys and the like of field staff.
8 Planning improvement measures
Once you have identified the real problem
to be solved and the root cause of the problem, you can finally make
improvements. The draft of the improvement plan is created by, for example, a
process analyst or business consultant.Which improvement plan is effective and
which should be given the highest priority is determined by a study group
including process owners and domain experts. It is a matter to be done
Of course, what kind of process improvement
should be done is case-by-case, but the following are standard approaches.
Reorganization of business procedures
Removal of problem activity
Activities integration
Parallel processing of multiple activities
Optimization of staffing
Automation
9 Improved process model creation and effect simulation
After the improvement measures to be taken
are drafted, create an “improvement process” when the improvement
measures are implemented, and simulate as much as possible. It examines how
much the number of processes can be reduced, and how much time and cost can be
reduced with the current process (as is process) and the improvement process
(to be process).
When creating an improvement process, you
should create a “BPMN compliant” flow using a modeling tool. Some
process mining tools include BPMN-compliant modeling capabilities. If not, you
will need to prepare a separate modeling tool.
10 Report making
A report is created that summarizes the
results of analysis up to now, the improvement process based on improvement
measures, and the results of the effect verification simulation. A common
report title is
“Process Mining Analysis Report for XXX Process-Problems and Solutions”.
Depending on the purpose and situation of
the analysis project, the report may be created up to the stage before the
planning of the improvement measures, that is, until the problem is identified.
Experts who are familiar with process
mining are called “process miners”.
Process mining itself can be narrowly
defined as an “analysis method”, but if it is broadly regarded as the
main methodology for business process reform / improvement projects and
continuous process improvement, process mining The domains involved are as
broad as:
Total management as a business reform / improvement project
Creating scoping (analysis plan)
Extract event log data from various systems
Data preprocessing (cleaning, etc.)
Creation of operation / analysis dashboard for process mining tools
Root cause analysis and improvement plan
Development and establishment of improvement measures
Establish continuous monitoring and improvement system
Of course, it would be difficult for an
individual to do all of the above. In reality, a team of data scientists,
system administrators, tool operators, business analysts, business consultants,
and others with a certain title will work together.
I believe that a process miner, whatever
the title, is someone who has the knowledge and experience to derive insights
from data analysis related to business processes and lead to improvements.
Therefore, in order to be recognized as a
process minor, we believe that it is necessary for each to acquire a wide range
of process-related knowledge while possessing special skills.
Here is the knowledge you need to acquire
as a process miner.
1. Basic knowledge of process mining
It is desirable to understand the
principles and principles of what is process mining in the first place, and
what is the basic approach of an algorithm that reproduces a process model from
event log data.
I believe that basic knowledge of process
mining is a basic subject for everyone involved in process mining.
2 Business analysis
Business analysis is a comprehensive
methodology for collecting and analyzing data about various aspects of your
business. The main points of business analysis are to understand the current
situation as accurately as possible and to clearly identify business issues,
leading to superior strategy planning, effective system requirements definition
and organizational restructuring.
If you consider process mining as an
analysis method, it can be positioned as an analysis method specialized for
processes included in business analysis. In a real process mining project or
business reform / improvement project, analysis of event log data is not
enough.In many cases, peripheral investigation and analysis, interviews for
root causes, workshops, etc. are performed. Therefore, it is better to have
knowledge of business analysis.
Business analysis knowledge is something
that a business analyst, of course, also wants a data scientist to have.
3 Business Process Management (BPM)
Business process management (BPM) literally
means controlling business processes appropriately. The purpose is to increase
profits, reduce costs, and improve customer satisfaction through continuous
improvement of business processes.
Therefore, BPM develops and organizes
various ideas and methods that cover the entire cycle from process development
to operation and transformation. Process mining can provide various forms of
support such as understanding the current situation based on data, simulating
improvement measures, and operational support in each phase of BPM.
Since the ultimate goal of process mining
is to reform and improve processes, knowledge of BPM is very important.
Business process management knowledge is a
must for business analysts and business consultants involved in process mining.
4 Database
Most of the extraction sources of event
logs to be analyzed by the process mining tool are transaction data stored in
the database in the business system.
Depending on the system, a function that
can download past operation history and transaction history collectively may be
implemented, but if not, analyze the structure of the database and determine
which table contains the data items required for analysis, You need to consider
which data items should be used as keys to connect the related tables, and how
to extract the three required items of the event log, that is, matter ID
(process ID), activity, and time stamp.
To do this, it is necessary to understand
at least the formation of databases, especially relational databases, in
addition to understanding business systems such as ERP described below.
Basic knowledge of DB is essential for data
scientists, IT managers, and process analysts involved in process mining.
5 Business system (ERP, CRM, etc…)
The processes that are often analyzed in
process mining are P2P (Procure-to-Pay), that is, the purchasing process, and
O2C (Order-to-Cash), that is, the order receiving process, which are often SAP
and Oracle. Is done on the ERP system.
ERP is a business system that covers all
corporate activities, so its database structure is complicated and its
functions are diverse. Therefore, by understanding the basic architecture of
ERP such as SAP and ORACLE, the DB structure, and the relationship between
functions, in addition to the basic knowledge of the database, it becomes
possible to smoothly perform event log extraction and preprocessing.
ERP knowledge is a must for process mining
data scientists, IT managers and business consultants.
6 ETL & Scripts(SQL, Python, etc…)
Data (transaction data) extracted from
various systems cannot be uploaded to the process mining tool as it is. It is
necessary to process the data into a format that can be analyzed by a process
mining tool, and to remove noise and the like to make it a clean file.
This process is called “data
preprocessing”, and “ETL” is a useful tool for data
preprocessing. I recommend using the open source “KNIME”. However,
there are many other tools that have the same functions, so it is fine if you
adopt one that is easy for you to use. In any case, if you are in charge of
data pre-processing, learning the ETL tool is effective.
Of course, if you are an engineer, you
should be able to perform data pre-processing even for scripts that are good at
SQL, Python, R, etc. However, the ETL tool has the advantage that it is easy to
explain to the stakeholders because the flow of data preprocessing can be shown
visually as a “workflow”, that is, a processing procedure.
Some of the process mining tools themselves
have a connector function that allows API connection or ODBC connection to
various systems and DBs to extract data and perform some preprocessing.
However, if the system is customized or if
it is necessary to correct garbled characters or missing data, it will be
necessary to process the ETL tool or script separately.
ETL & Scripting is essential knowledge
and skills for data scientists and IT managers.
7 Tool operation
The tool operation method differs
considerably for each process mining tool, so you have to learn by using the
tool that you operated. However, when performing advanced analysis, standard
functions often cannot be covered, and dashboards are often customized and
various charts are created. In this case, the same approach as BI design
(analysis dimension = dimension and aggregation method = measure setting) and
SQL-like formulas are required, so it is necessary to learn and adapt
accordingly.
8 Lean Six Sigma
Lean Six Sigma, which originates from the
Toyota Production System, has been adopted by many companies worldwide as an
approach to help identify root causes and plan solutions for business process
reforms and improvements.
Process mining merely exposes process
inefficiencies and bottlenecks as phenomena, does not tell the root cause of
why such problems are occurring, and naturally suggests solutions. It doesn’t
even give me. (Although it gives us clues)
Therefore, a separate methodology is needed
to identify the root cause, plan a solution, prioritize it, and put it into a
concrete development plan based on the current situation obtained from various
analysis results including process mining.
Lean Six Sigma is essential knowledge and
skills for business consultants engaged in process mining.
市場リーダーのCelonisは既に社員数800人を抱え、大型の資金調達にも成功して「ユニコーン」としても認められる存在。そして、リーダーグループの一角を占めるSoftware AGは、「ARIS」のブランドで知られ、「ARIS Process Mining」の販売にも力を入れてきています。また、先ごろ買収したProcessGoldを「UiPath Process Mining」と名称を変え、UiPathが強みを持つRPAを含んだトータルソリューションとして提案力を強化しています。
Major Contender、すなわちリーダーグループに闘いを挑んでいる主要な競争ベンダーはまさに群雄割拠という状況。なお、私が把握している限りですが、日本においてなんらか連絡先があるのは、ABBYY Timeline、LANA Lab、myInvenioの3つだけです。
Let’s consider the value of process mining
from the viewpoint of “business strategy”.
This time, the framework of the strategy
used is “Value Discipline Model,” which was shown by author M. Treacy and F.
Wiersema in “THE DISCIPLINE OF MARKET LEADERS”.
In the book, they argued that businesses
should focus on where each company can provide unique value, rather than trying
to provide everything to every customer. They state that there are three
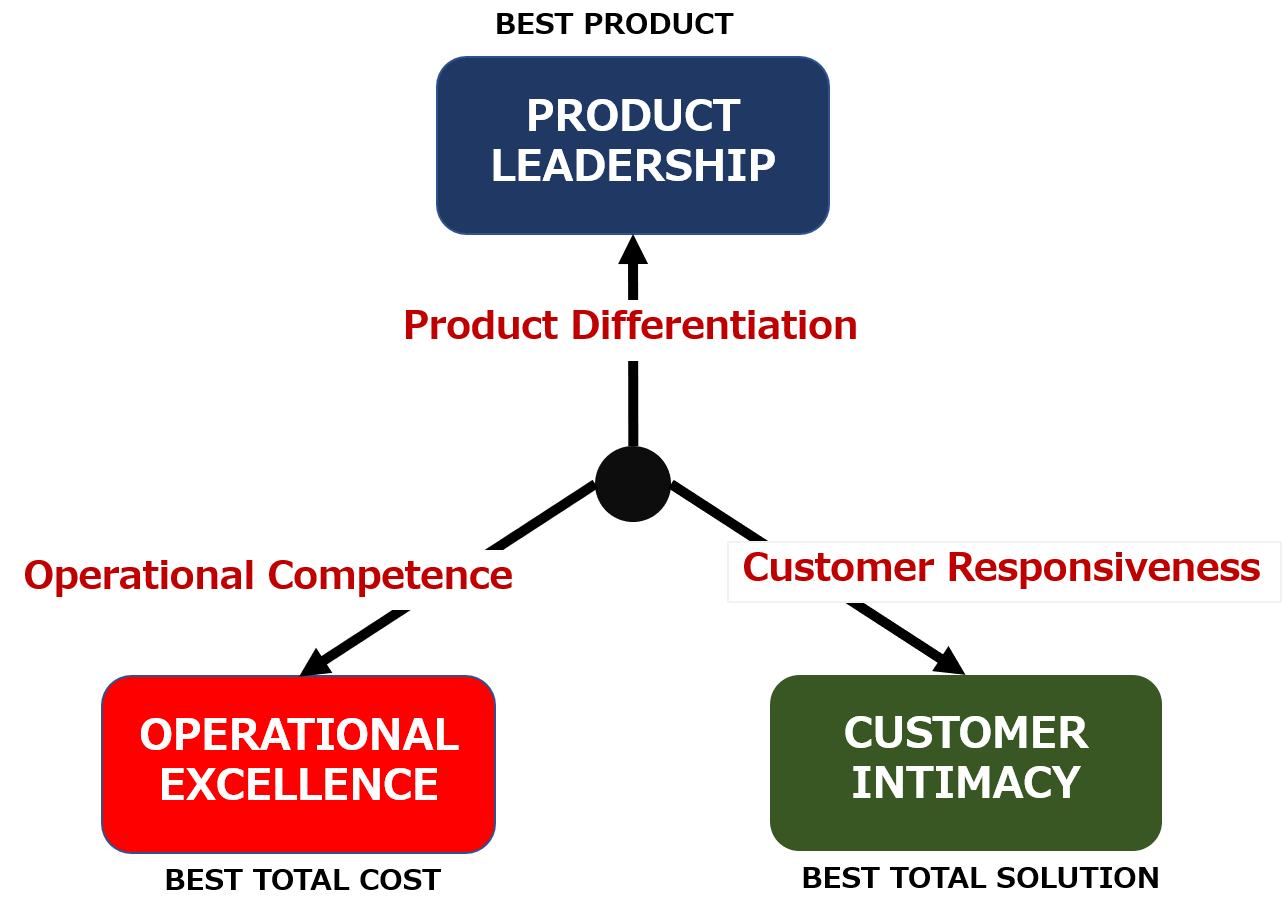
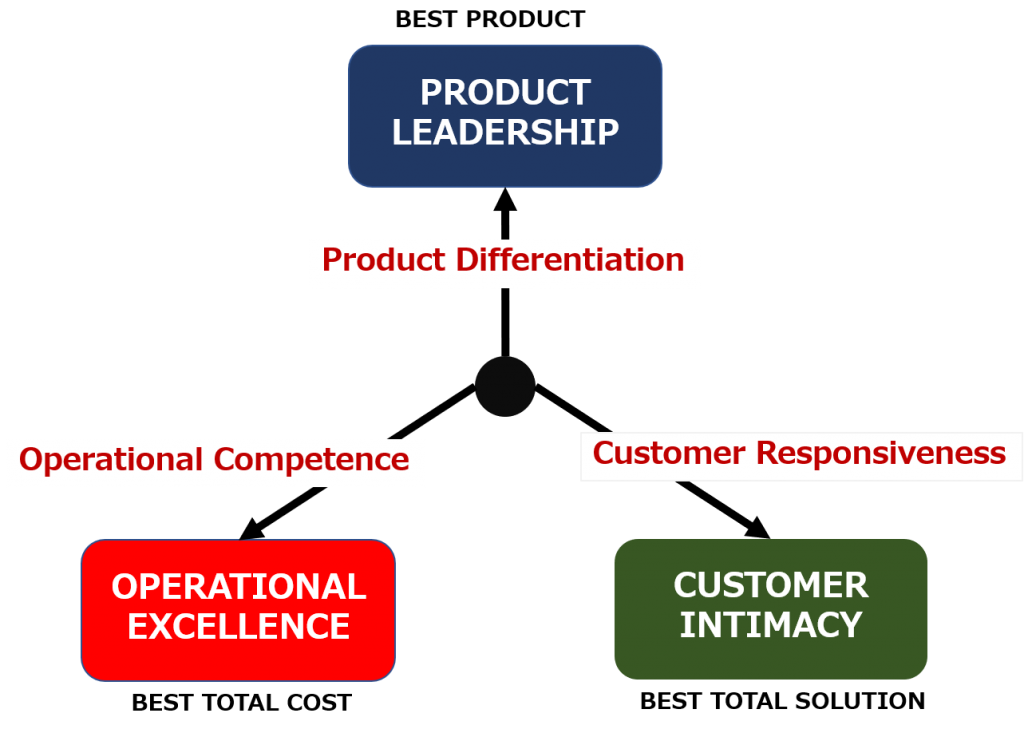
strategic directions as shown in the value model below.
1 PRODUCT LEADERSHIP
Providing the best products by enhancing
the competitive advantage of a product.
2 CUSTOMER INTIMACY
-Build close relationships with customers
and provide the best service.
3 OPERATIONAL EXCELLENCE
-Improve business efficiency and offer the
best price.
Product leadership is an approach that
enhances the competitive advantage by presenting unique features that are not
found in competing products. Apple is a typical example for Product leadership.
In addition to superior functions, iPod, iPhone, iPad, etc., which have
increased the attractiveness of outer design, have been introduced one after
another by them.
Customer intimacy is an “intimate” service
that treats customers with tailored care and strengthen and maintains strong
ties, such as the Ritz-Carlton Hotel.
Operational excellence is an approach that
maximizes efficiency, lowers costs, and offers customers a competitive price. McDonald’s
is one of them who are primarily pursuing this approach in the hamburger
industry.
By the way, these three basic strategies
were proposed in 1995, 25 years ago, but they can still be said to be effective
as a way of thinking. Since each of these requires huge investment of
management resources and excellent business operations.
However, the dramatic advances in various technology
and especially the advancement of digitalization are important to note first
that it has become extremely difficult to “product leadership”, that
is, to continue to differentiate our products.
For example, in the automobile industry, in
the era of gasoline cars, proprietary technology was required for each
component, whether it was an engine or a transmission, and imitating was not so
easy. However, many parts are modularized in electric vehicles, making it
difficult to make a difference in basic performance.
In “Customer Intimacy,” manufacturers and
consumers can directly interact with each other through the Internet, and as a
result of the fact that many consumer behaviors take place online, vast amounts
of data on individual customers Accumulation and analysis can be performed, and
detailed responses are becoming possible.
The ultimate in “customer
intimacy” is not “one-to-many” but “one-to-one”, but
digital technology is making it as realistic as possible. Therefore, many
companies will also be able to provide the same level of service in customer
intimacy, and may not be able to fully demonstrate their unique value.
But what about “operational
excellence”? Even if it can be systematized and automated to some extent,
it will become increasingly difficult to keep operating costs appropriate and
maintain margins while maintaining appropriate customer intimacy in response to
sophisticated and complex customer needs.
The pursuit of operational excellence is,
after all, the optimal design of end-to-end business processes and ensuring the
execution of daily business processes.
In other words, how thoroughly business
process management (BPM) is performed is the key to achieving operational
excellence. And, process mining helps BPM to understand the current process
based on data and identify inefficiencies and bottlenecks. It can also be used
for simulations to develop ideal processes and for real-time monitoring of
daily business processes.
Given this, I think that process mining can
be said to have higher value among companies that pursue operational excellence
among the value-based models.
I need to add that in the first place, the execution of any strategy should break down into business processes, and it is required that the business processes be executed as expected, so the value of process mining is not limited only to the pursuit of operational excellence.
The term “Process Intelligence” is often used in process mining documentation and vendor information.
The definition of “Process Intelligence” varies from vendor to vendor, but there is no clear definition, therefere many people are confused about how it differs from process mining.
In this article, I would like to explain the relationship and differences between “process mining” and “Process Intelligence”, explaining “Business Intelligence” at the same time.
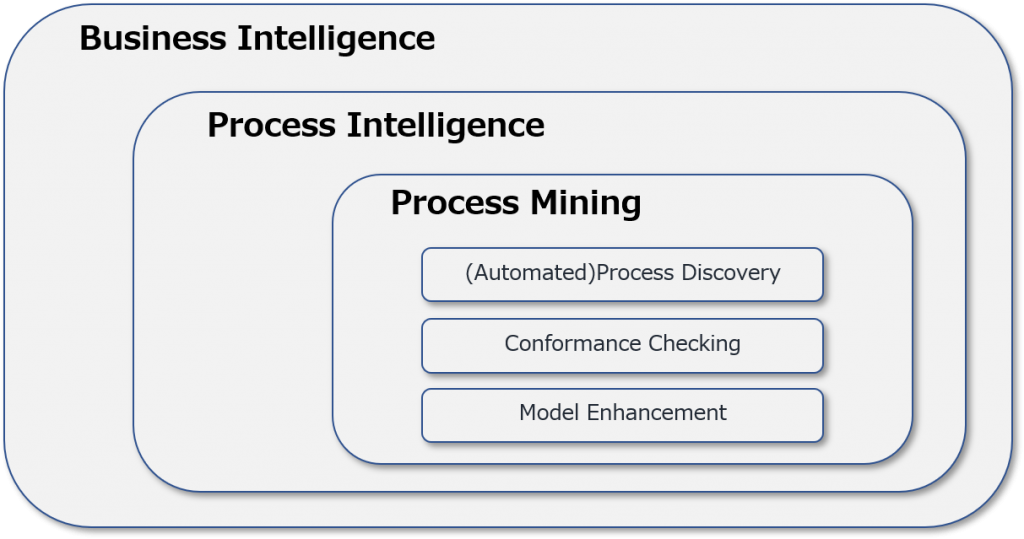
In fact, the relationship between the two is clear, as illustrated in the “process mining manifest” published in 2011.
Source: Process Mininig Manifest(2011)
As you can see, the largest frame is the “Business Intelligence”, inside which is the “Process Intelligence”, and inside which is the “process mining”. They are nesting relationships.
Business intelligence is literally the collection and analysis of all the business related data and information. The analysis is often conducted using so-called BI tools, typically starting from financial data such as sales and profits, we look at trends by fiscal year, month, and week, and drill down by area and product to delve into the areas and product categories that contribute to sales and profits, as well as the factors that are hindering them. This is business intelligence.
“Process Intelligence” is a type of business intelligence analysis that focuses on data and information related to business processes. Furthermore, “process mining” is an analytical method based on the flow of business process, or “Control Flow” in process intelligence.
Some people say that since process mining is basically included in business intelligence, can it be replaced by business intelligence?
However, the basic function of process mining, “(automatic) Process Discovery” requires a special algorithm that BI tools typically do not equipped with. And it is not practical to build algorithms for process mining based on BI capabilities from scratch (Even if you could build an elementary one, the process model that you reproduced would be unreliable.)
Therefore, if you want to do process mining, you need to use a dedicated process mining tool, which BI cannot replace.
So where does process intelligence cover?
In addition to process discovery using special algorithms, the Process Mining Tool calculates various statistical values and presents them in various tables and graphs.
For example, the number of issues involved in the process being analyzed, the throughput from start to finish of the process (cycle time), the number of activities per activity, the processing time, the transition time (path time) from one activity to another, or the wait time. The average, maximum and minimum, median, and standard deviation of these values can also be checked.
These statistics can be calculated on the basis of simple arithmetic operations without the need for special algorithms. It’s easy to do with BI. That’s where “Process Intelligence” covers.
In the process mining analysis, based on the “process model” (as is process model) discovered through the algorithm, various variations are verified “variant analysis”, and comparative analysis with ideal processes (to be Process), that is, conformance checking, is performed.
In addition, identify problem activities where processing time exceeds KPIs and bottlenecks where waiting time is too long. Basic statistics such as number of processes, processing time, and waiting time are important.
In other words, process mining involves drilling down into process intelligence figures from various perspectives in conjunction with process models.
The major process mining tools have standard process intelligence capabilities with dashboards that visually represent various numbers, as well as algorithms for creating process models. In this sense, it is safe to say that the current process mining tools are “process intelligence tool”.
プロセスマイニングの生みの親は、”God Father of Process Mining”と呼ばれる、オランダ人のWil van der Aalst氏(RWTH Archen大学教授、以下Aalst氏)です。
コンピュータサイエンティストとして、世界的に著名な Aalst氏の主要専門分野は、情報システム(IT)、ワークフローマネジメント、プロセスマイニングであり、Archen大学では、Process and Data Scienceグループを率いています。
Aalst氏は1990年代後半、オランダのEindhoven University of Technology(TUe、以下TUe)においてワークフロー、ワークフローマネジメントを研究するなかで、現状の業務プロセスを把握するための既存の手法、すなわちインタビューやワークショップでは、主観的で断片的な情報に基づく不完全なプロセスモデルしか描けないことに問題を感じていました。
Aalst氏は、2011年にプロセスマイニングに関する初めての著作『Process Mining: Data Science』(現在は2016年版)を出版、また2014年にはCouseraで当著作と同じタイトルのMOOC、すなわちeラーニングコースを開発、提供を開始しています。当eラーニングコースは、これまでに世界中で数万人が受講しており、プロセスマイニングの基本的な知識・ノウハウを広めることに寄与しています。
欧州においてプロセスマイニングが本格普及期に入ったのは、2015年ころからです。2018年以降はRPAに続く、大きな成長分野として注目が高まりました。2019年には、国際的なプロセスマイニングコンファレンス、「International Conference on Process Mining 2019」がドイツのArchenで初めて開催されました。2020年には、イタリアのPaudaで同コンファレンスが開催予定です。
欧州以外のエリアでは、ProMと同じオープンソースのプロセスマイニングツール「Apromore」が開発されたUniversity of melbourneの研究者を中心にオーストラリアでの取り組みが活発です。
Process mining is a young technology that
just turned 20 in 2019. Here’s a brief history of process mining.
The creator of process mining is Dutch researcher, Wil van der Aalst, Professor, RWTH Archen University, being called as “God Father of Process Mining”.
As a computer scientist, world-renowned Aalst’s key areas of expertise include information systems, workflow management and process mining, and at Archen University, leads the Process and Data Science Group.
In the late 1990s, while studying workflow
and workflow management at Eindhoven University of Technology (TUe) in the
Netherlands, Aalst was challenged by the fact that existing methods for
understanding current business processes — interviews and workshops — could
only draw incomplete process models based on subjective and fragmented
information.
On the other hand, in the 1990s, business systems such as SAP ’ s ERP became widespread, and many of the business operations in various departments of companies and organizations were conducted on IT systems.
So Prof. Aalst came up with the idea that
business processes could be replicated from the operational history, or event
log, recorded in IT systems. According to Aalst, the term “process
mining” was first used in a research proposal he wrote in 1998.
Aalst began working on process mining in
earnest in 1999. Therefore, 1999 is the year of the birth of process mining,
and Holland is the birthplace of process mining. Since the early 2000s,
academic research has been actively carried out by TUe and other European universities.
The first algorithm used to reconstruct the process model from the event log was “Alpha Algorithm”. Since then, various algorithms such as “Heuristic Miner” and “Inductive Miner” have been developed to represent more reliable process models.
In 2004, the first version of
“ProM” an open source process mining tool, was developed. ProM is
still being upgraded and is mainly used for research. ProM is unique in that it
is used for research, and the latest algorithms and new functions are provided
as plug-ins one after another.
The first process mining company that no
longer exists, “Futura” was founded in 2007. Since around 2010,
companies specializing in process mining have emerged one after another.
ProcessGold, which has been acquired by UiPath in October 2019, was established in 2009. After graduating, Anne Rozinat, who studied process mining under Aalst and received a master’s degree, founded Fluxicon in 2010 to develop a process mining tool called “Disco”. In 2011, the current industry leader, Ceonis, was born.
With new process mining tools on the market since 2010, it’s Anne of Fluxicon who’s done the most to raise awareness and understanding of process mining in Europe by holding “Process Mining Camp” every year since 2012 besides Prof. Aalst.
Aalst published his first work on process mining in 2011, ‘Process Mining: Data Science in Action’ (The current version is 2016.), and in 2014 developed and began offering MOOC with the same title of the book, an e-learning course, at Cousera. Tens of thousands of people around the world have taken this e-learning course, helping to spread the basic knowledge and know-how of process mining.
In Europe, process mining started becoming
widely used around 2015. Since 2018, it has gained attention as a major growth
area following RPA. In 2019, the first international Process Mining Conference,
“International Conference on Process Mining 2019” was held in Archen,
Germany. In 2020, the conference will be held in Pauda, Italy.
Outside of Europe, Australian practice is centered around researchers at the University of Merlbourne, which developed the open source process mining tool “Apromore”.
Process mining has been practically introduced in both the U.S. and Japan since 2019. In Japan, the “Process Mining Conference 2019” hosted by Impress attracted 500 participants and showed great interest.
In Korea, Puzzle data, which has a
“ProDiscovery” developed by a researcher who studied under Aalst, has
a track record of introducing process mining in Korean companies.
In the case of Japan, although the two
tools Celonis and myInvenio have a strong presence in the market at present, it
is certain that various process mining tools will be introduced to Japan and
the market will expand.
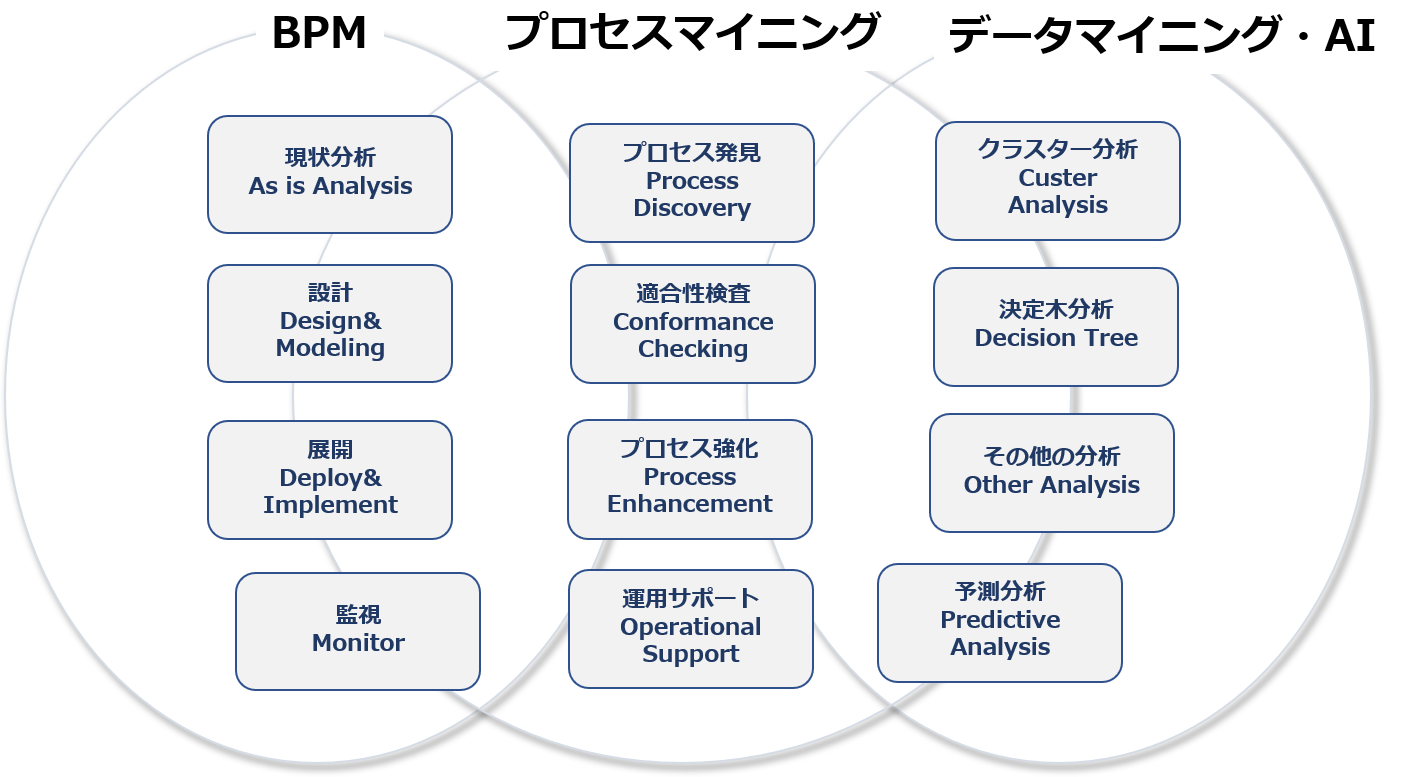
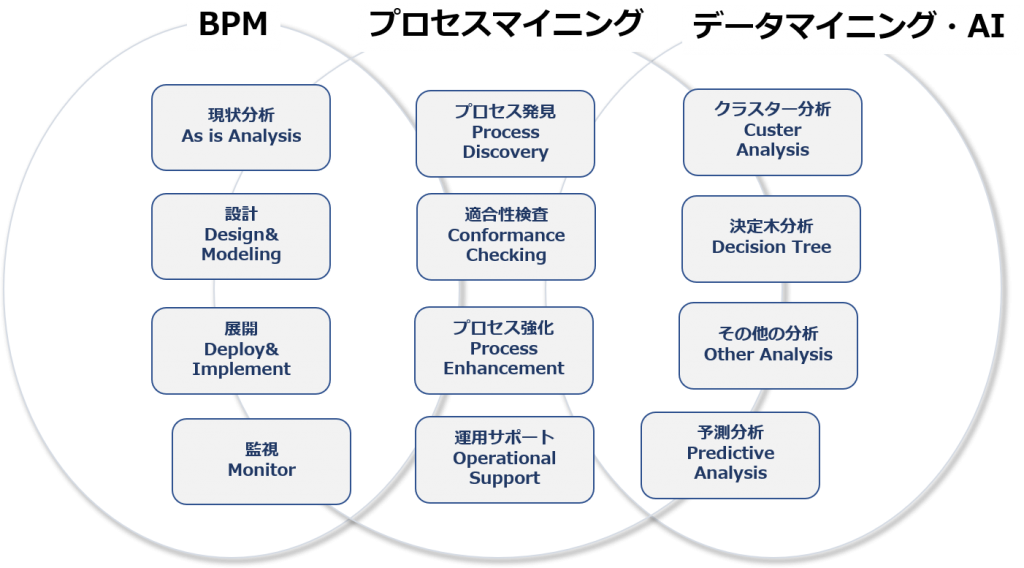
このように、プロセスマイニングとデータマイニング・AI、BPMはお互いに補完しあえる関係にあると言えます。プロセスマイニングのゴッドファーザー、Wil van der Aalst教授は、「プロセスマイニングは、データマイニングとBPMをつなぐ橋である」と述べられていますが、まさに、BPMの取り組みにおいて、プロセスに特化したデータマイニングとしての「プロセスマイニング」は大きな役割を果たしていくと思われます。
プロセスマイニングは、業務分析が対象とする幅広い業務の側面のうち、「業務プロセス」を主たる分析対象としています。プロセスマイニングは元々は、「BPM(Business Process Management)」、すなわち、「ビジネスプロセスマネジメント」の枠組みにおいて、現状(as is)の業務プロセスを明らかにするための分析手法として誕生したからです。
Frankly, process mining is just a business analysis to get a handle on what’s going on.
Of course, process mining is able to conduct business analysis much more accurately and efficiently than conventional interviews and observational surveys with field staff, and for this reason, it has rapidly gained attention in recent years.
In many cases, process mining is used in BPR(business process re-engineering) or business process improvement projects.
Therefore, it is important not only to understand the procedure of process mining as an analytical method, but also to understand and utilize the procedure and framework of BPR or business process improvement.
There are various approaches to BPR and business process improvement, but I think it is best to adopt Six Sigma’s methodology as a foundation.
Six Sigma is a business process improvement method developed by Motorola based on the Toyota Production System concept. That is, it includes many frameworks that originated in Japan.
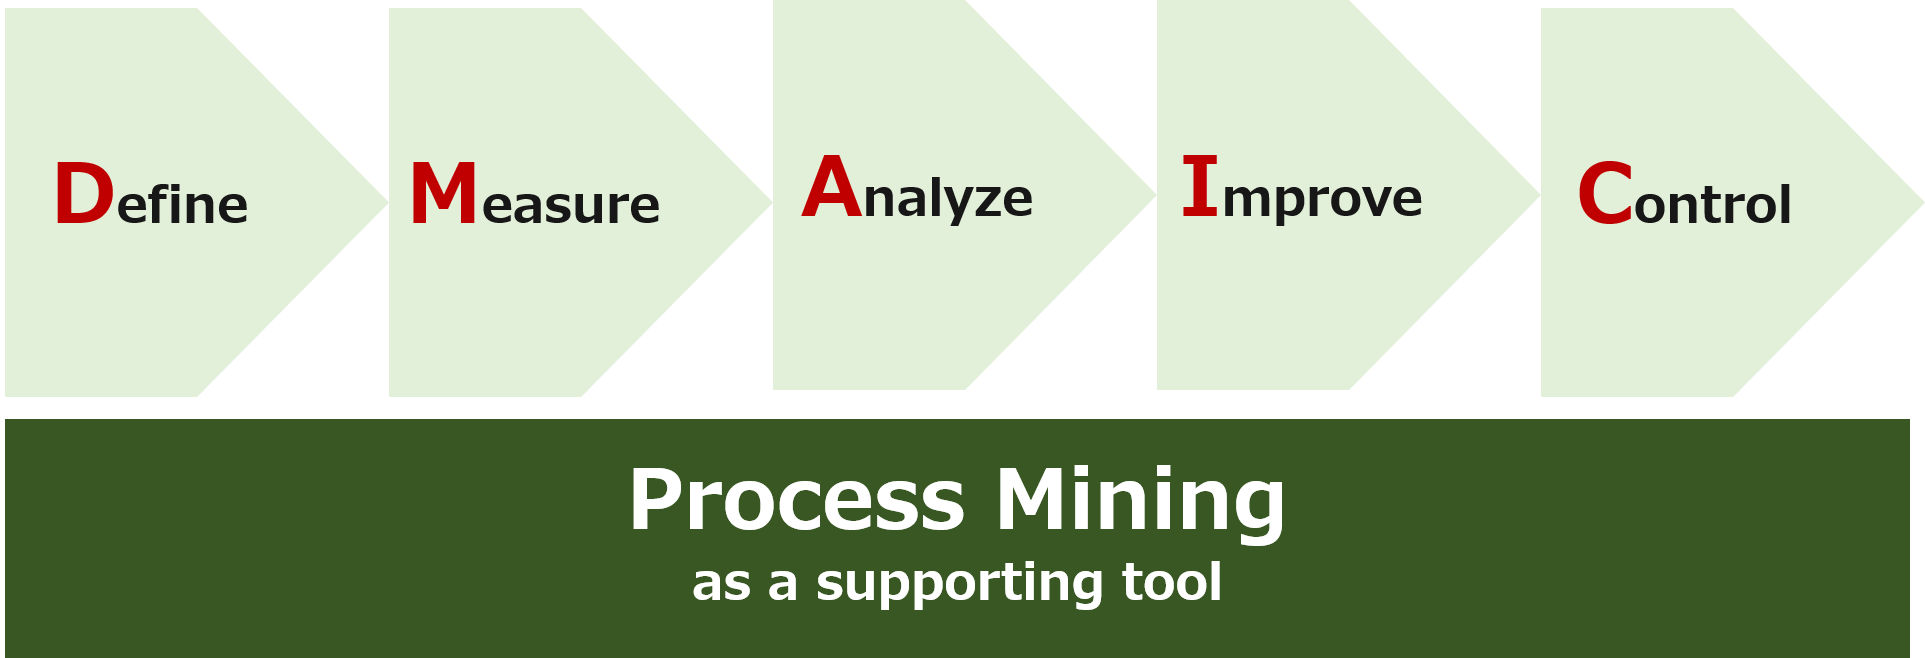
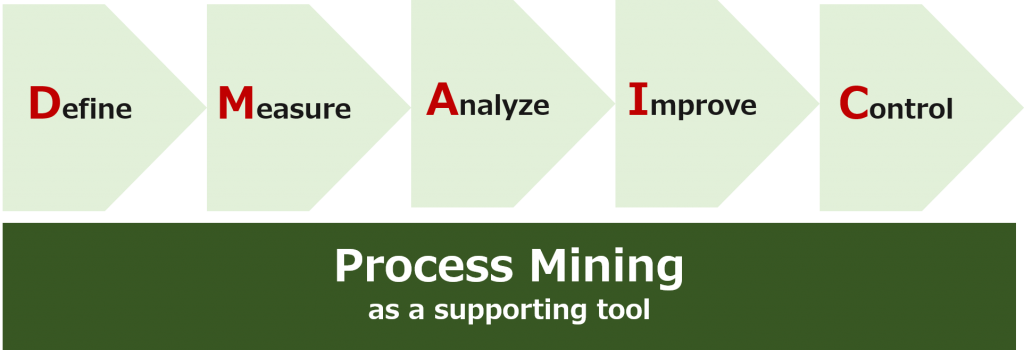
The process improvement project at Six Sigma is known as the “DMAIC”. It is an acronym for the following five phases of activity.
Define
Measure
Analyze
Improve
Control
A brief description of the relationship between each activity phase and process mining.
Define
First, identify the processes that need to be improved, as well as potential problems and issues. Basically, problems that can be identified as phenomena, such as excessive overtime and exhausted employees, or an increase in customer complaints due to delivery delays, are identified and identified as problems in which processes are likely to have problems, and are targeted for improvement.
This is the prerequisite phase of the process mining project “scoping” or “analysis planning”.
Measure
Collect the data and information needed to understand the current situation. As mentioned earlier, it has traditionally been customary to hold interviews with field staff, conduct observation surveys, and hold workshops with all concerned parties to take inventory of current business processes.
In process mining, in addition to the information gathering methods described above, “Event Log”, which is historical data of business performance on IT systems, is extracted and analyzed.
The process model (as is Process) obtained from process mining enables accurate reproduction of fact-based business processes. However, it is of course impossible to grasp the operations that are being conducted outside of the system. Therefore, complementation through interviews and observational surveys is essential.
Analyze
We conduct analysis from various perspectives based on information and data obtained in the previous phase.
In the case of a project using process mining, based on a process model derived from an event log, it is possible to easily find bottlenecks where work is taking too long, inefficient, or stagnating, so that it is possible to delve into the analysis of interviews and field investigations where such problems have been identified.
If process mining is not adopted, field interviews must begin with the question, “What are you doing and how are you doing it? (What, How)” However, if you look at the process model, you can ask the question, “Why does this happen? (Why)” making it easier to pursue the root cause.
Improve
Once the root causes of problems and issues that appear to be phenomena (Inefficiency, bottlenecks, etc.) have been clarified, specific improvement measures will be formulated and improvement activities will be carried out. Since it is the execution stage, the process mining is retracted to the stage, but the event log is steadily accumulated for the next Control (establishment and management).
Control
The last is to establish and manage improved business processes. You can develop better business processes and deploy them in the field, but if you leave them as they are, you can go back to the old ways.
Therefore, continuous monitoring and appropriate guidance are needed to ensure that new processes take root. By utilizing process mining, it is possible to extract and analyze in real time operation history data that is executed on an IT system on a daily basis, and to quickly find deviations and problem points in an ongoing project and issue alerts, thereby ensuring that new business processes are implemented.
As new IT tools emerge, some people have the illusion that they are a universal solution.
Of course, there’s no one-size-fits-all tool, and since it’s just a tool in the first place, user skills are more important. Even if you have a kitchen knife with the best sharpness, you’ll know that if you’re not used to using a kitchen knife, you can’t cook ingredients well.
Process mining tools are, of course, more than one-size-fits-all; they’re just analytical tools. Most importantly, there is no “What should I do?” solution in the analysis. In fact, the results of the analysis do not explain why “Why is it so inefficient?” or “Why bottlenecks?”.
What can be discovered not only by process mining tools, but also by analytical tools such as BI is nothing more than “location of the problem”. By analyzing the flow diagram drawn from the event log, that is, the “as is process model” from various angles, it is easy to identify where the problem lies in the business procedure.
But they don’t tell us why there’s a problem. By digging deeper into the problem, you can narrow down what is causing the problem.
For example, in the sales order process (O2C), you know that the throughput (overall lead time) from the sales order to the delivery date is longer than expected, and you rate it as “matter”. Using process mining tools, we can analyze by product, customer, etc. to find out which products or customers tend to take longer to deliver.
This is very useful information, but we still don’t know the “Why is that?”. If you don’t ask why, you won’t be able to come up with an effective solution, but you need to interview the person in charge of the site and do some observational research.
The ultimate purpose of process mining is not to conduct analysis, but to solve management issues such as improving business processes and promoting digital transformation (DX).
However, the direct purpose of process mining as an analytical method is to “elucidation of the underlying cause”. We should not immediately consider measures to improve the situation just because we have identified the problem areas through analysis.
For example, suppose you discover that a process is taking too long, or inefficient. So, I think there are people who would rush to take easy improvement measures, thinking that it would be more efficient if we introduced RPA and automated it.
In the first place, I asked a field representative why it took so long, and before the RPA, it was easy to save time by skipping the scheduled steps.
So once you get the results, you have to go back and try to figure out the root causes. Only when the root cause is known, it is possible to plan effective improvement measures, not superficial therapy.
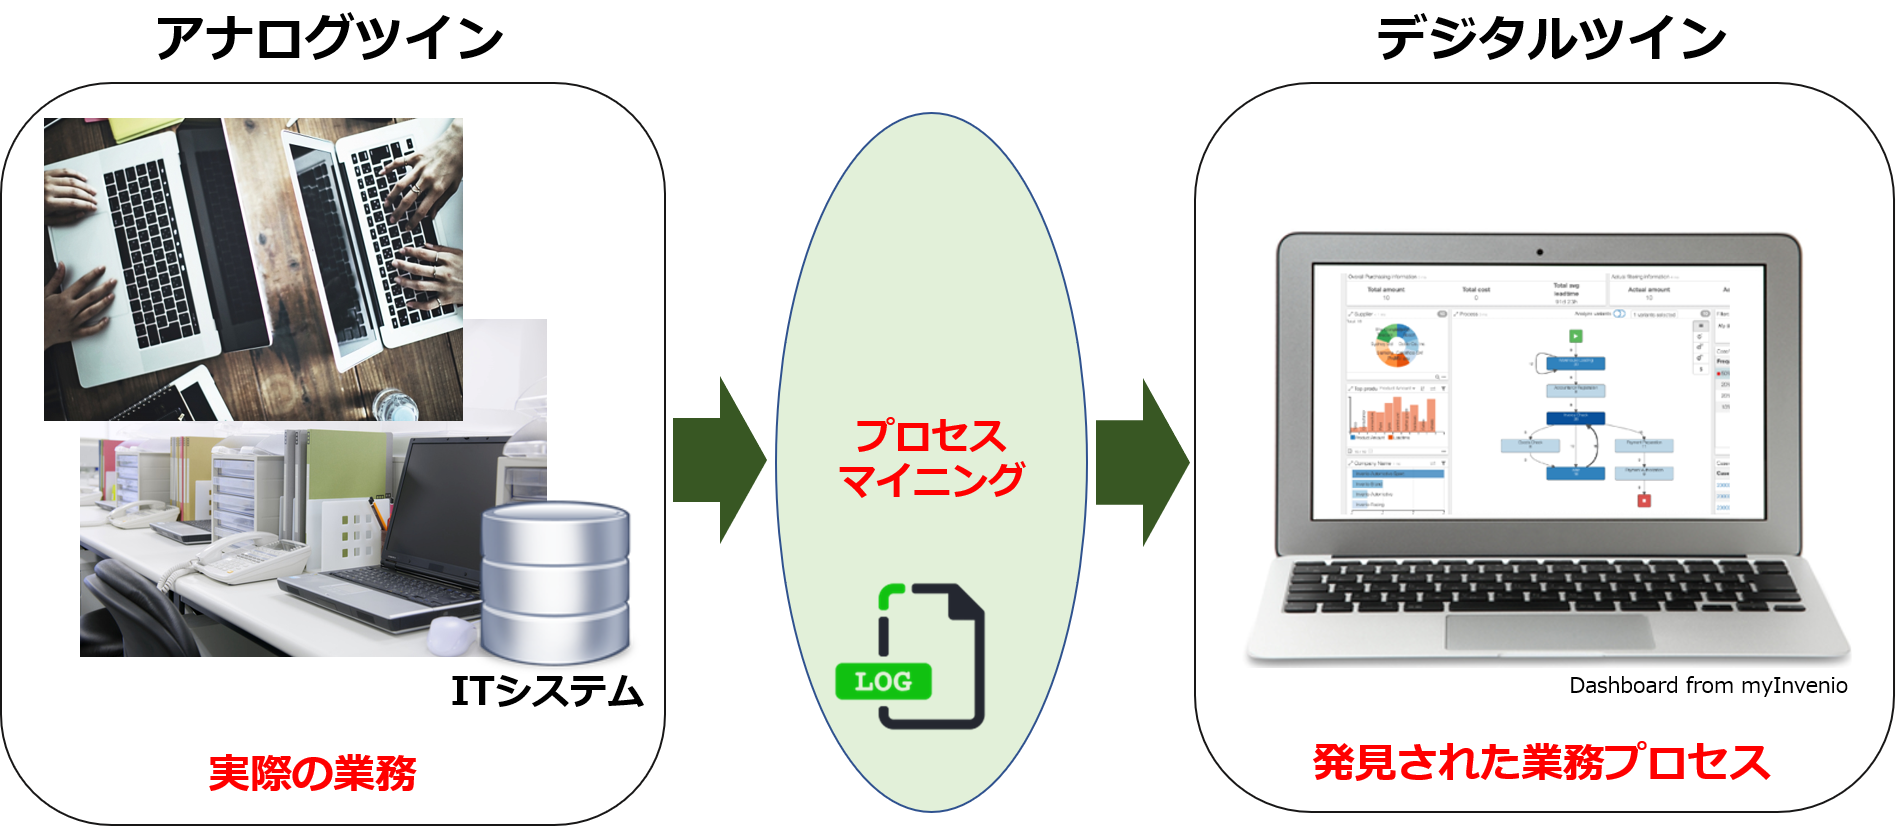
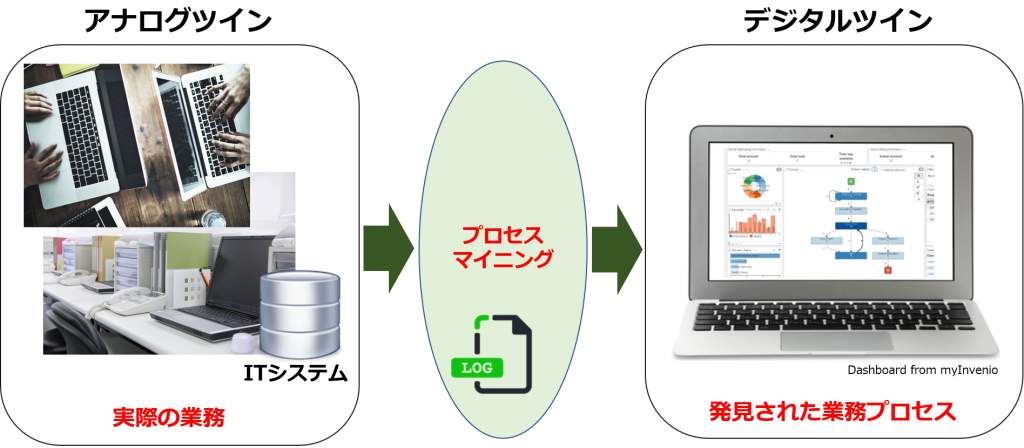
“Digital twin” is not limited to business as a pure technology, but in process mining, it stands for “Digital twin of an organization”.
The literal translation of “Digital twin of an organization” is “one digital half of twins of an organization “.
On the other hand, the other half is “Analog half of twins of an organization” where employees work together in the analog field. However, since much of the work is now performed by IT systems, the work remains as a digital footprints.
By analyzing digital footprints, or “Event Log” through process mining, it has become possible to visualize previously unseen business operations. The flow of business processes can be “discovered” as a flowchart.
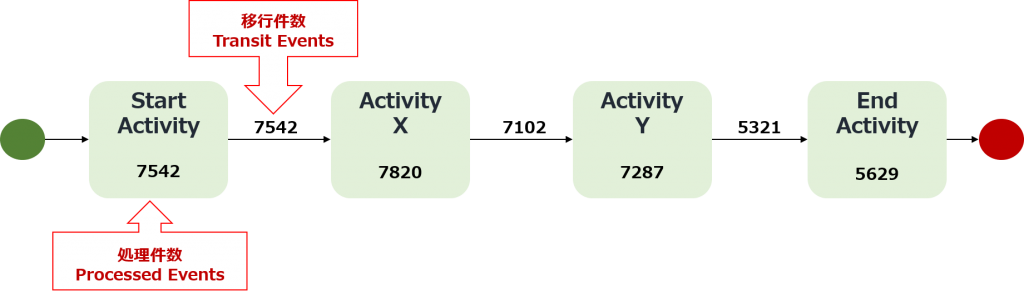
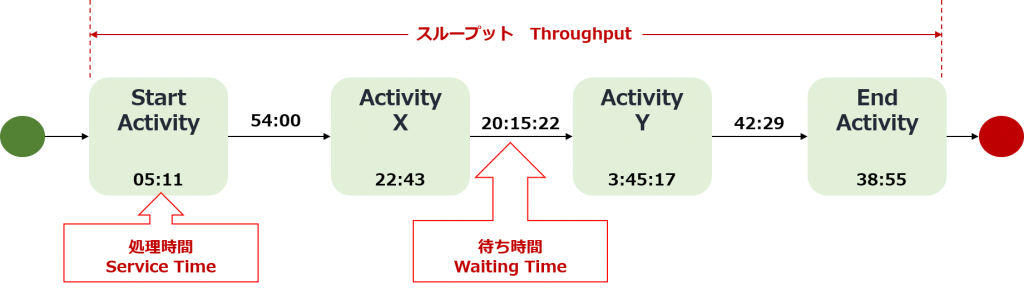
With process mining, we can calculate the number of cases processed, the “Processing time (service time)” per activity, and the transition time from the previous process to the next process, i.e., the “Wait Time (waiting time)”, etc., making it easier to identify areas with high workload and bottlenecks with stagnant business.
In addition, it is possible to clearly understand who is in charge of what kind of work and who is collaborating and collaborating with each other through work.
It is important to be able to clarify, based on the facts, the flow of work, the number of processes, the time required, and the functions involved in collaboration that were only vaguely understood. The flow charts and diagrams visualized by process mining are truly “digital twin” that reproduce the way an organization works and the contents of business operations based on digital data.
The benefits of a digital twin are not just accurate fact-based reality. With a digital twin, you can simulate what happens if you delete or change some of the processes, or if you automate some of the processes with the RPA and see the overall impact.
In other words, after examining how to improve business processes to reduce lead time, reduce costs, and eliminate bottlenecks, it is possible to apply the method to an analog twin, that is, a real process.
In addition, by flowing the event log continuously recorded on the IT system into the process mining tool in real time, the work execution situation in the field can be monitored in the digital twin, and the problem can be corrected immediately.
As you can see, process mining is an essential tool and solution for achieving a digital twin.